Suppose that wine bottles coming from Sonoma County Wineries have wine content (in ml) that is uniformly distributed between 115 ml and 125 ml. Consider taking a random sample of 100 such bottles and recording the wine content for these 100 bottles.
Which of the histograms best represents the approximate distribution of the wine content for 100 randomly selected bottles from Sonoma County Wineries?

1.Histogram I
2.Histogram II
3.Histogram III
Question 2Given a population that is normally distributed with a = 65 and = 3, the probability of randomly selecting an object greater than 68 is:
1.0.5000
2.0.6827
3.0.8413
4.0.1587

 Port Wine Hemangioma
 Shipwreck bottles
 Adjust the water coming from the faucet so that the temperature is comfortable. Water too hot can ...
 Plastic Bottles
 Consider the production function ( ) 0.5 0.5 Y = AK L . Suppose both saving rate (s) and the ...
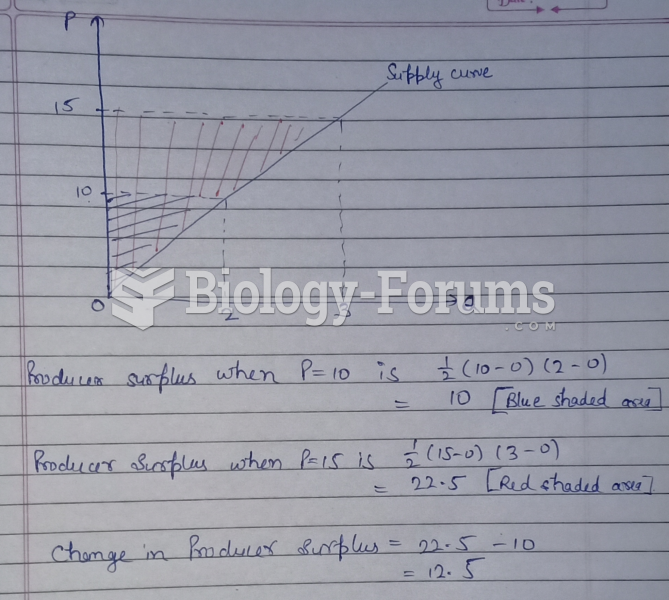 Suppose the market supply curve is p = 5Q. If price increases from 10 to 15, the change in ...