This topic contains a solution. Click here to go to the answer
|
|
|

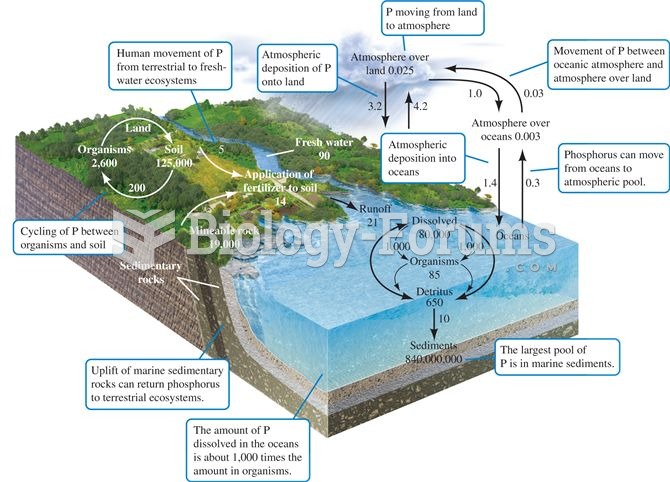 The phosphorus cycle. Numbers are 1012 g P or fluxes as 1012 g P per year (data from Schlesinger 199
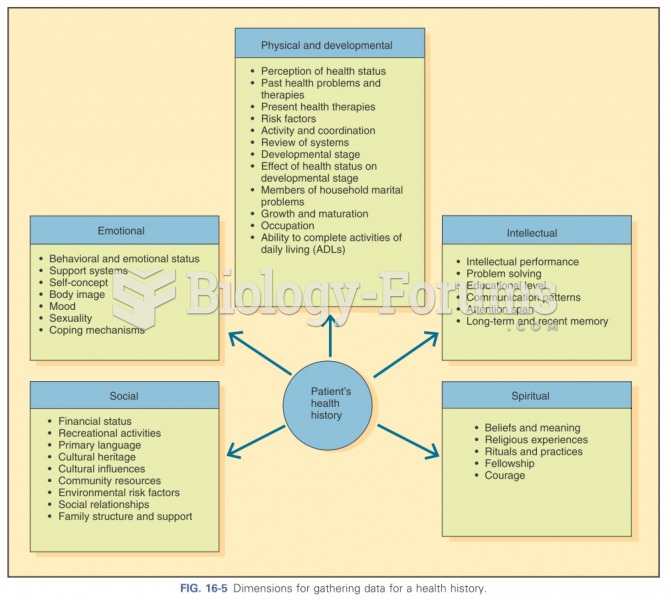 Dimensions for gathering data
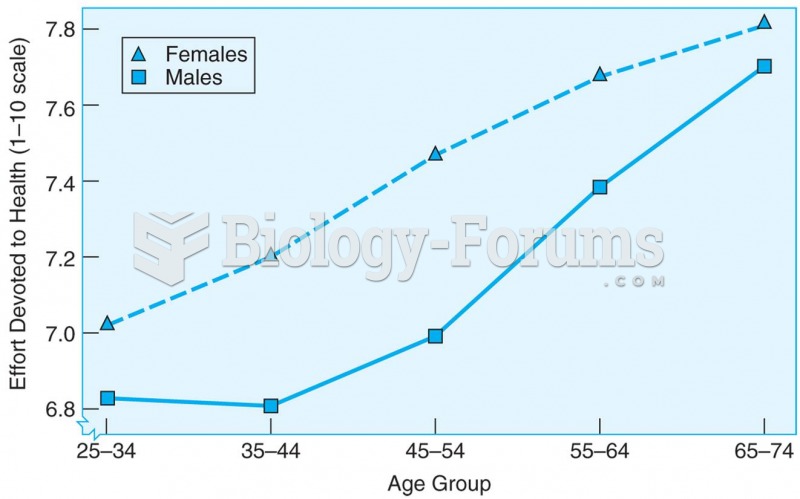 Cross-sectional data showing that the amount of effort spent on personal health care increases with
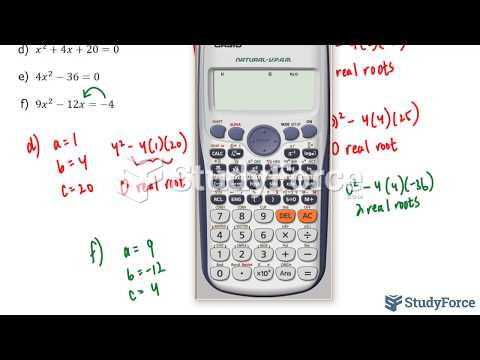 How to use the discriminant to determine the number of roots for any quadratic equation
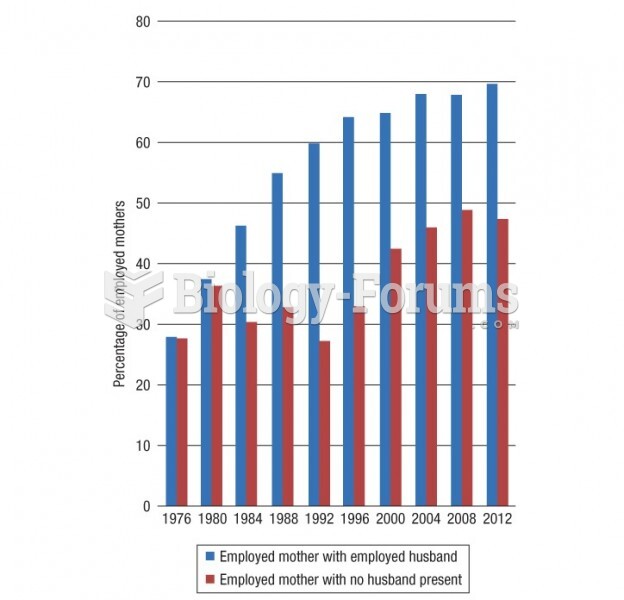 Trends in employed mothers with a child/children younger than 3 years of age
 Ribosome structure and tRNA-binding sites interpreted from cryo-EM–generated data