This topic contains a solution. Click here to go to the answer
|
|
|

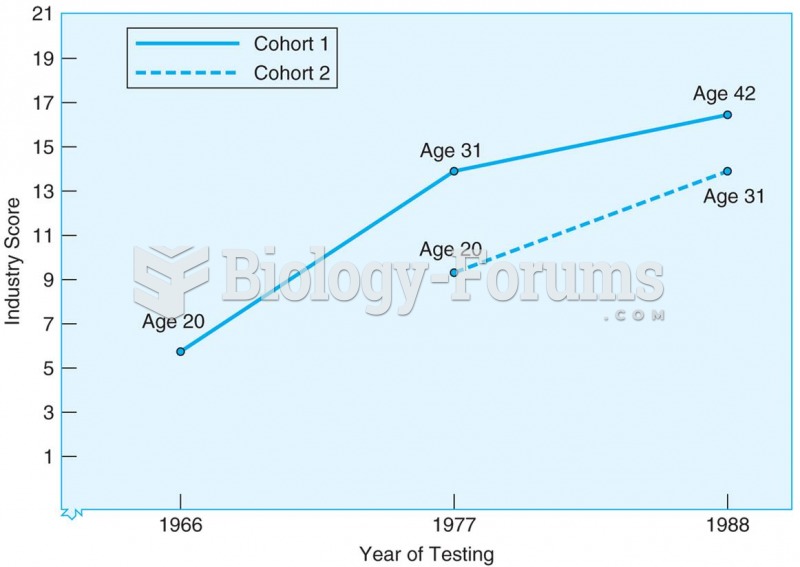 Results from sequential study of two cohorts tested at three ages and at three different points in t
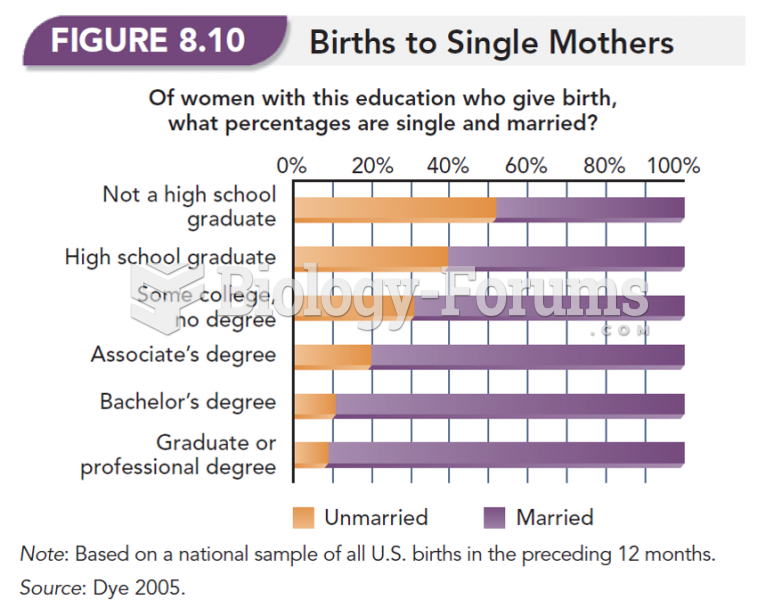 Births to Single Mothers
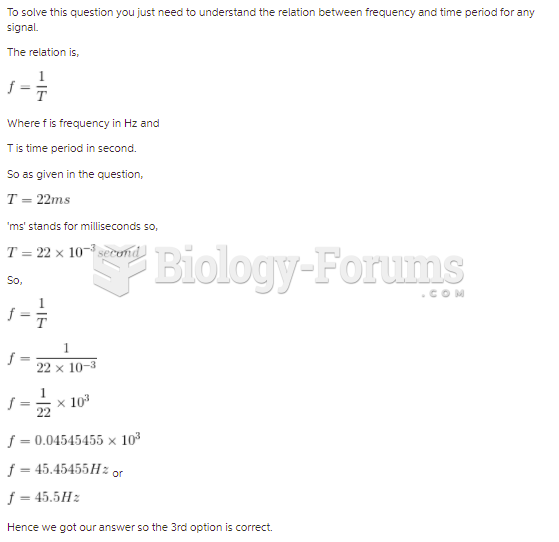 If the period of a square wave is 22 ms, what is its frequency?
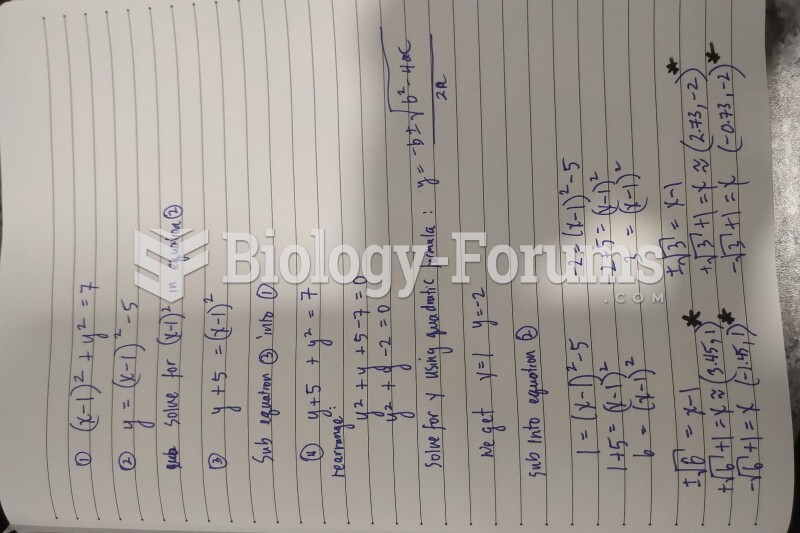 What if the equation for the parabola is a trinomial? How would you substitute the y-points ...
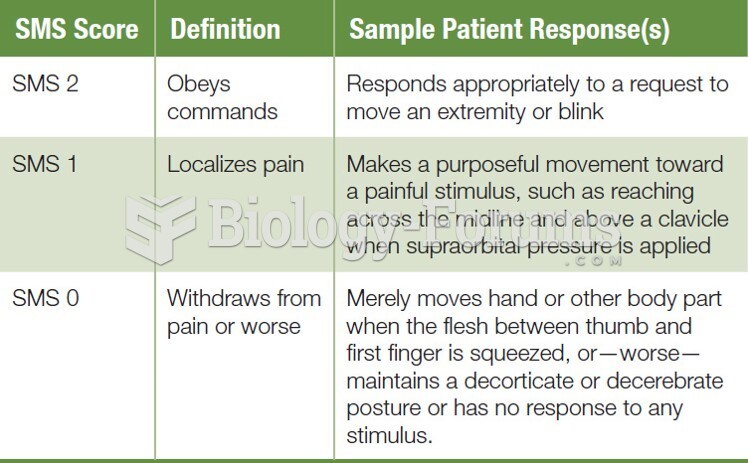 Simplified Motor Score
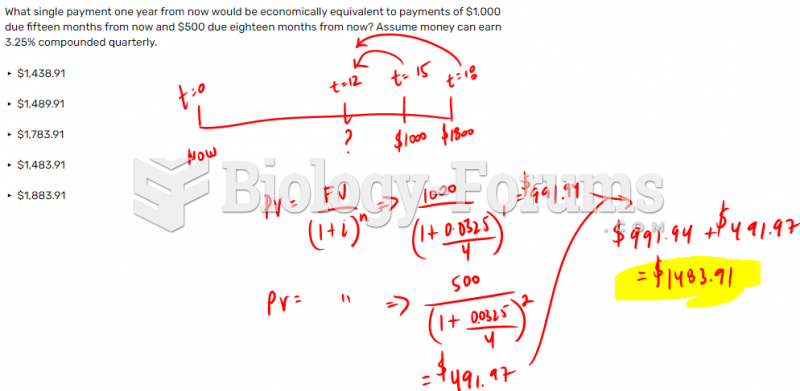 What single payment one year from now would be economically equivalent to payments of $1,000 ...