This topic contains a solution. Click here to go to the answer
|
|
|

 This image shows an artists depiction of a 10-kilometer (six-mile) diameter astero
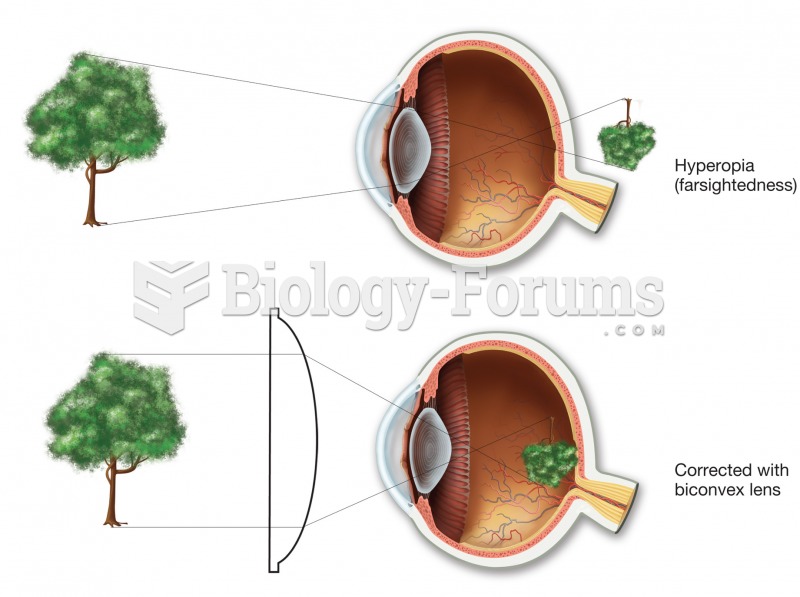 Hyperopia (farsightedness). In the uncorrected top figure, the image would come into focus behind th
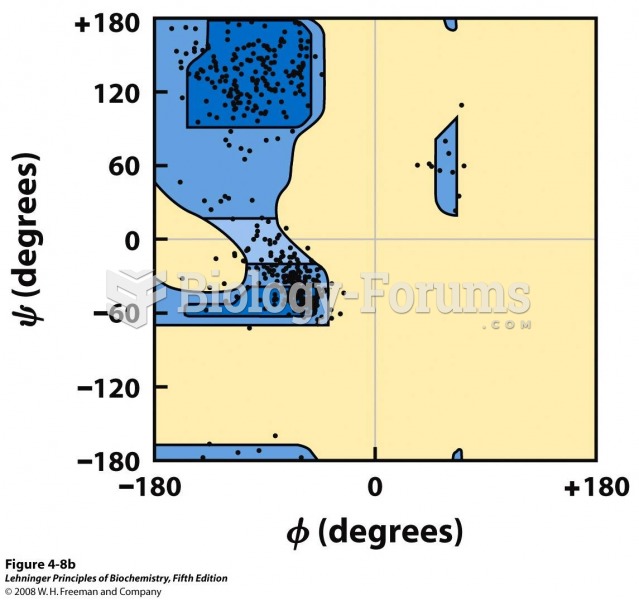 The values of Φ and Ψ for all the amino acid
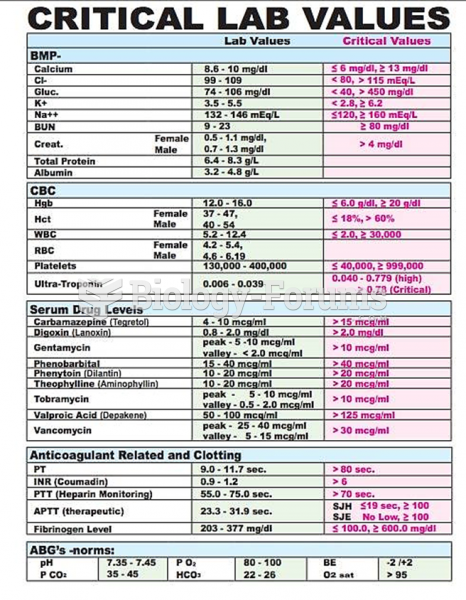 Lab Values
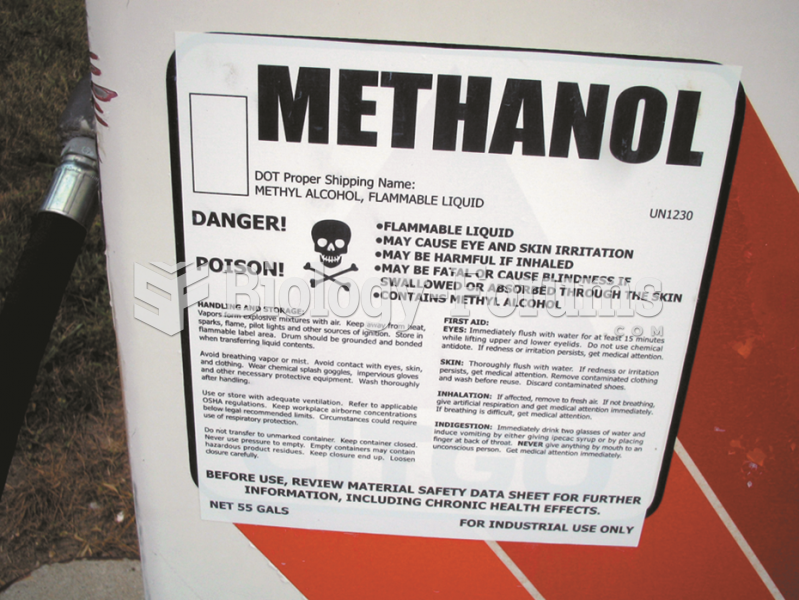 Sign on methanol pump shows that methyl alcohol is a poison and can cause skin irritation and other ...
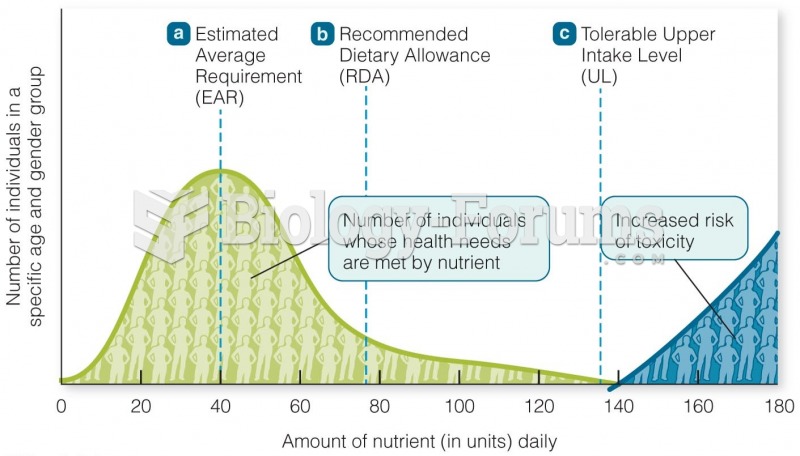 The Dietary Reference Intakes Are Reference Values for Each Nutrient