This topic contains a solution. Click here to go to the answer
|
|
|

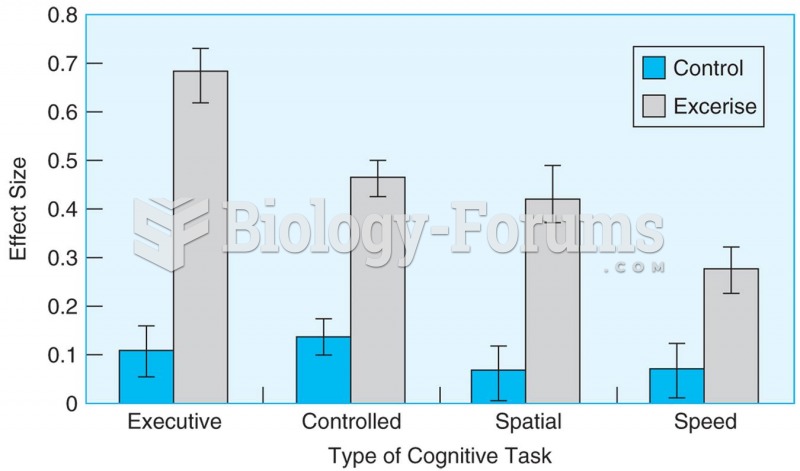 Meta-analysis of 18 studies shows that aerobic exercise causes better performance in older adults on
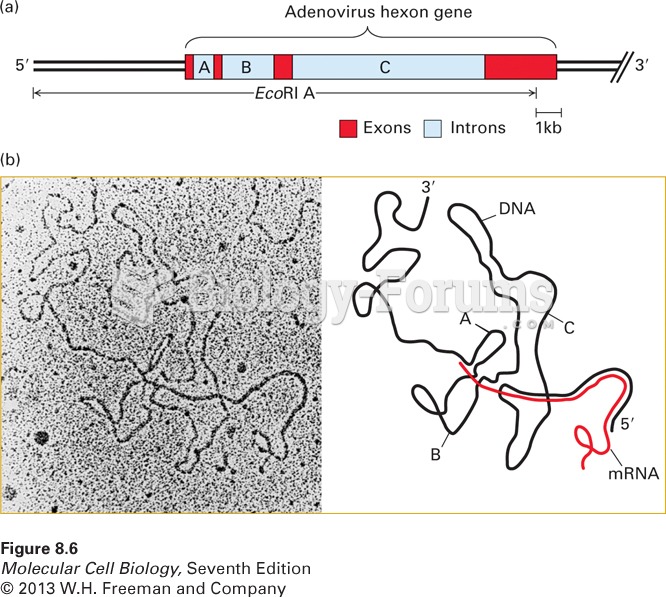 Electron microscopy of mRNA-template DNA hybrids shows that introns are spliced
 Vertical filing systems offer an alternative to traditional upright storage systems
 This battery shows a large “1000” on the front panel but this is the CA rating and not the ...
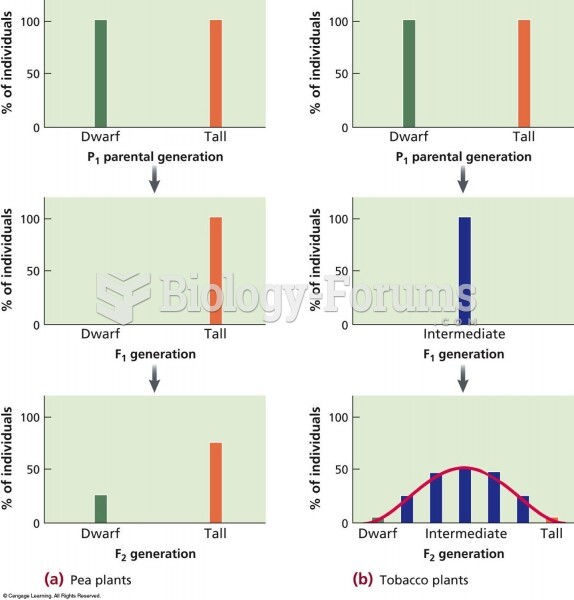 A comparison of a trait (height) that shows discontinuous and continuous phenotypes in different pla
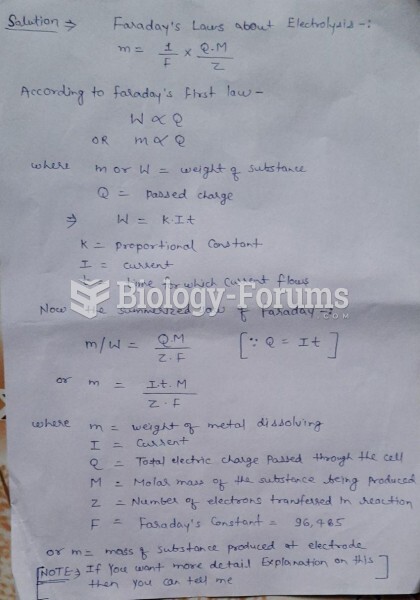 Identify the variable representing each described quantity in the equation