This topic contains a solution. Click here to go to the answer
|
|
|

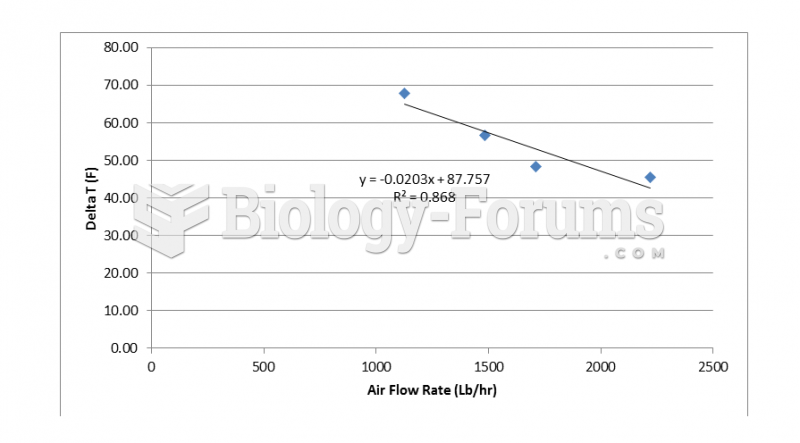 Change in air temperature at various air flow rates for a 7 pass operation
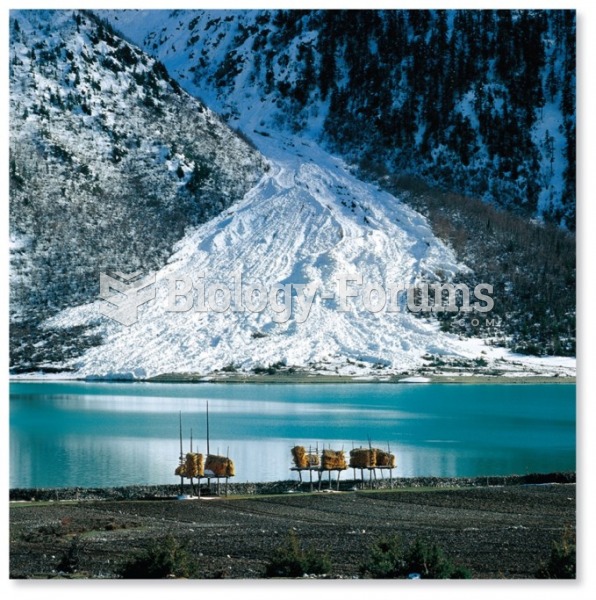 Desertification and Climate Change
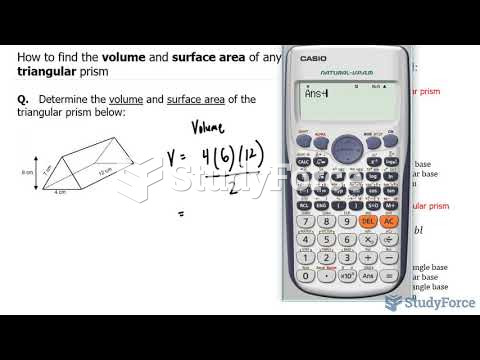 How to find the volume and surface area of any triangular prism
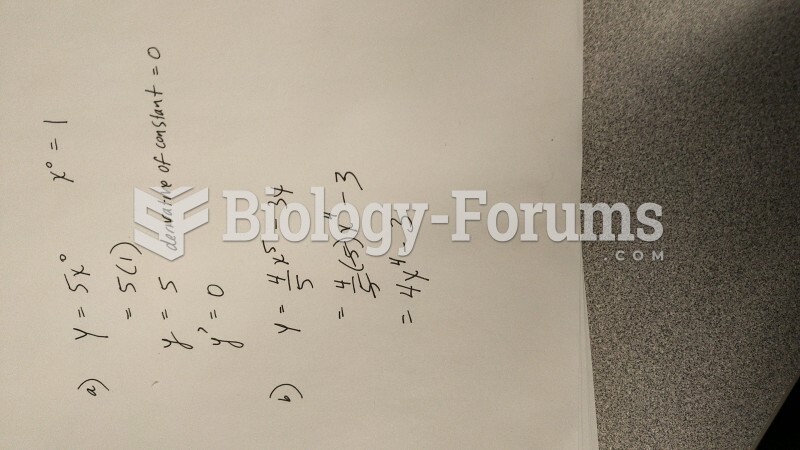 Finding the derivative using the power rule - Solutions
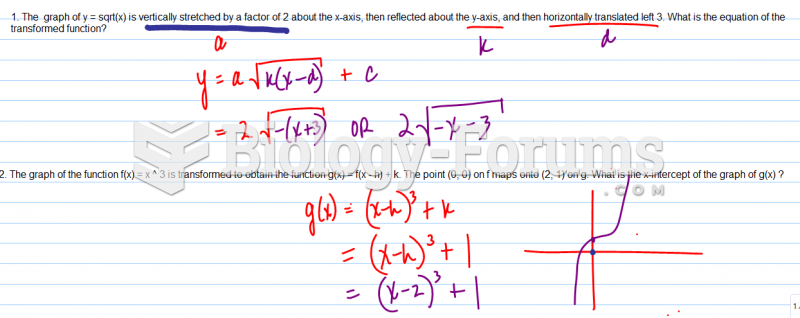 The graph of y = sqrt(x) is vertically stretched by a factor
 A 60-kg skier starts from rest from the top of a 50-m high slope. If the work done by friction ...