This topic contains a solution. Click here to go to the answer
|
|
|

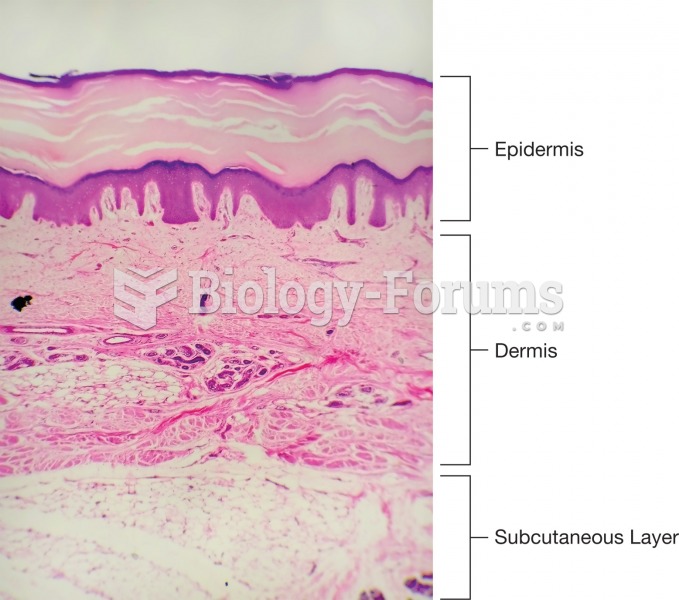 Photomicro graph showing the three layers of the skin.
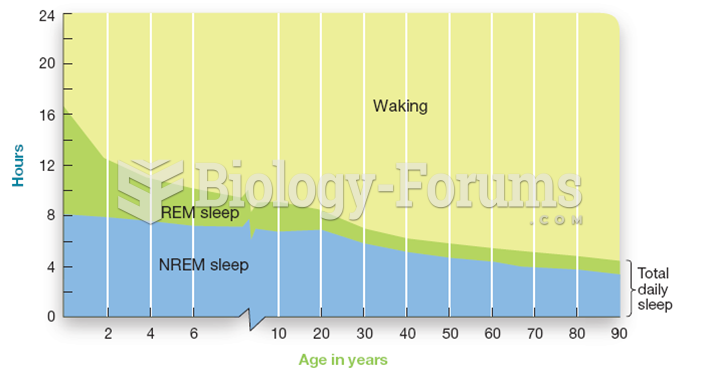 Sleep Requirements Change with Age
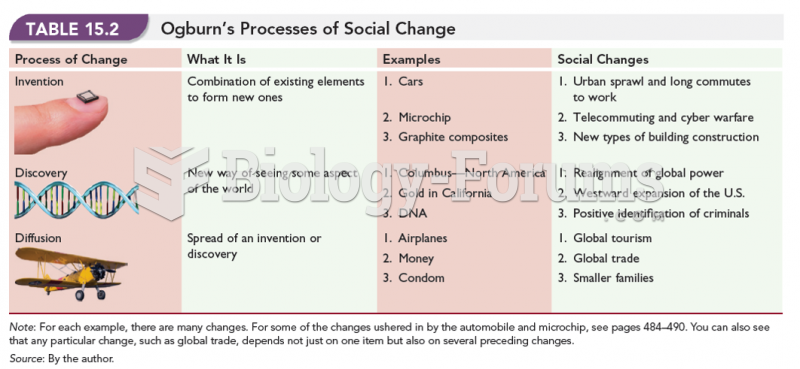 Ogburn's Processes of Social Change
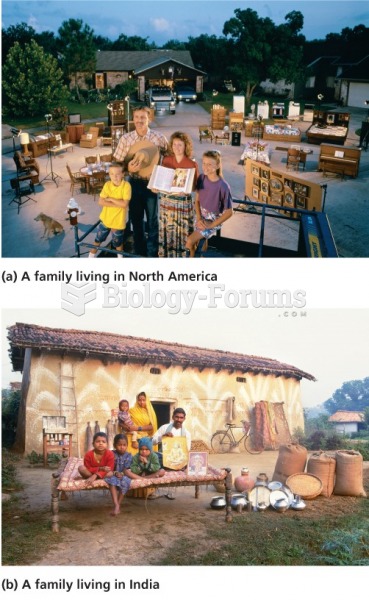 Demographic change and the effect on people social, and economic life
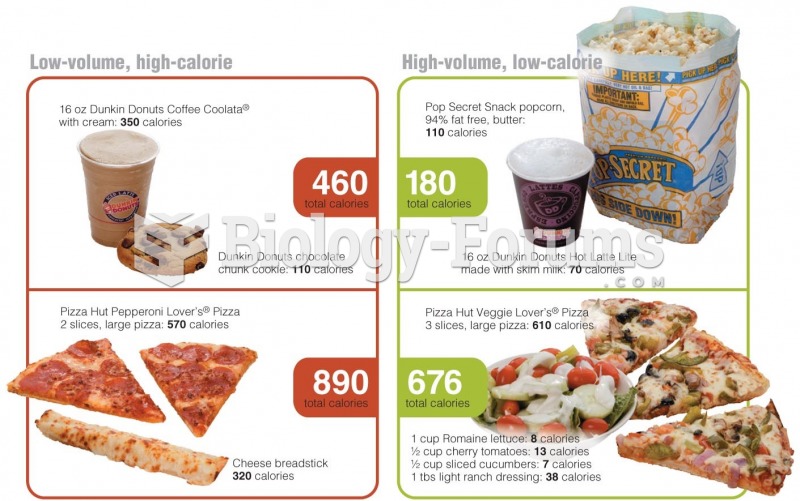 The Volume of Food You Eat Affects Satiety Low-volume
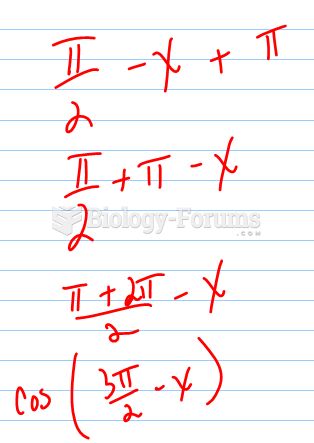 How to find the possible equations of a graph?