|
|
|

 Eating is a nutritional as well as a social time
 A health history is essential in collecting subjective data about metabolic acidosis.
 Upper GI series.
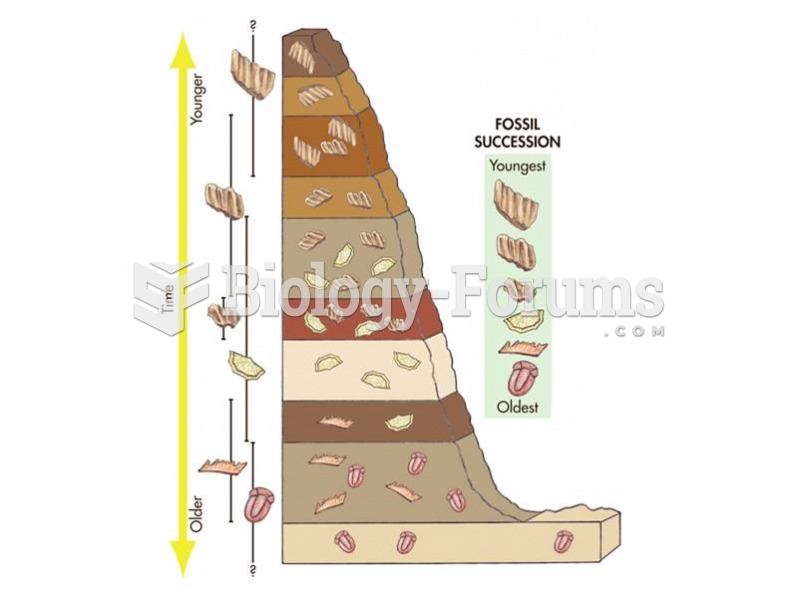 The principle of faunal succession uses animal fossils to tell relative time.
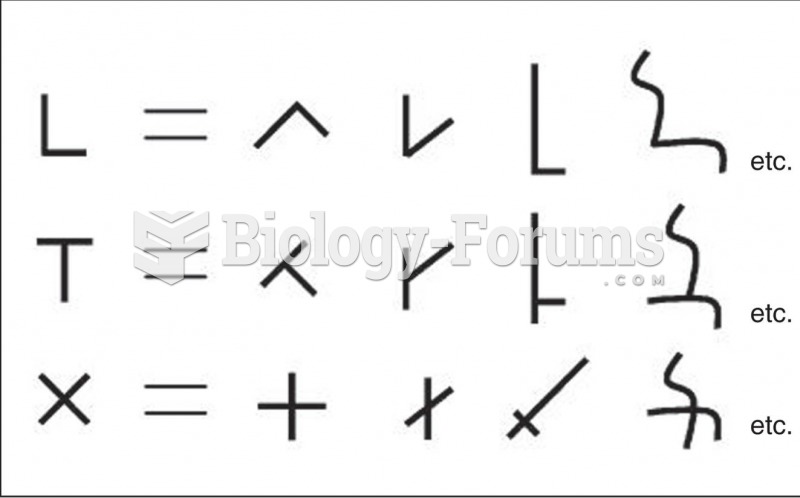 Examples of Ways That Different Types of Intersections of Two Line Segments Can Be Transformed into
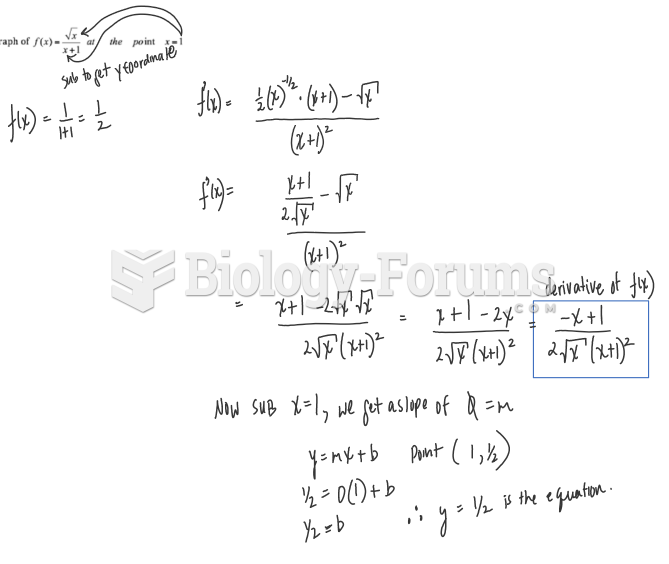 Find an equation of the tangent line to the graph of f(x) = sqrt(x) / (x+1) at the point x=1