|
|
|

 In 2008, the U.S. economy suffered a gaping wound as several trillion dollars were ripped out of it.
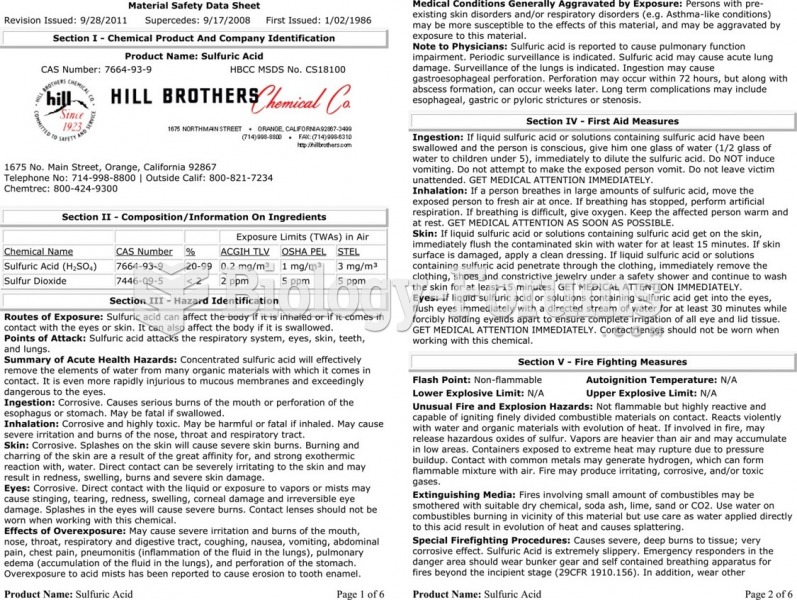 The material safety data sheet (MSDS) for sulfuric acid showing the detailed technical information ...
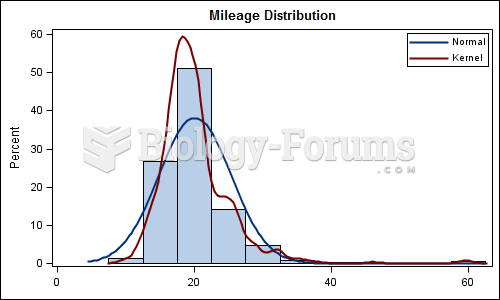
 How to calculate the mean for grouped data
 How to analyse a pathological stage plot?
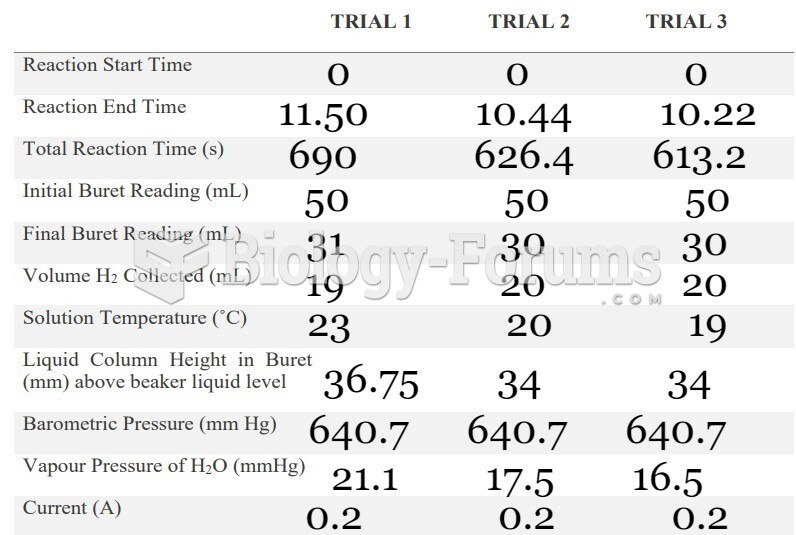 data
data
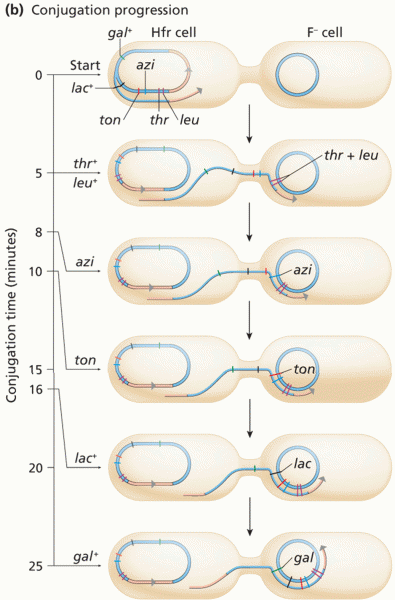 Time-of-entry mapping