|
|
|

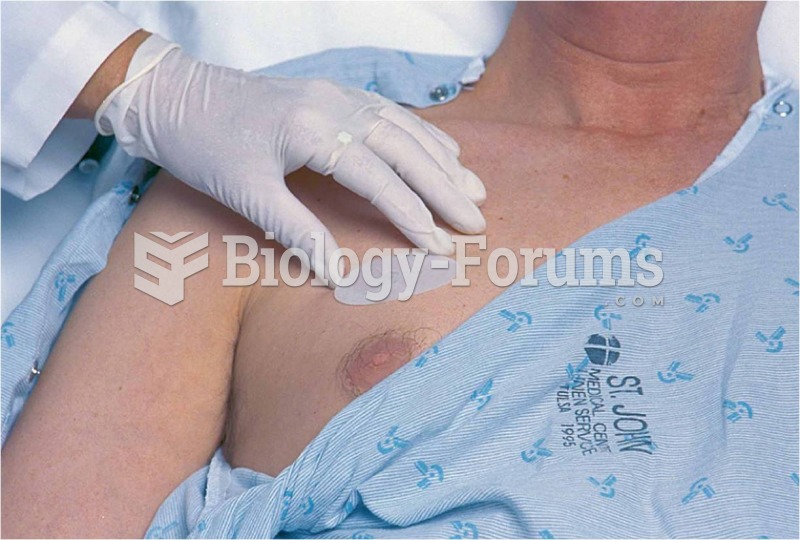 Transdermal patch administration: (b) patch immediately applied to clean, dry, hairless skin and lab
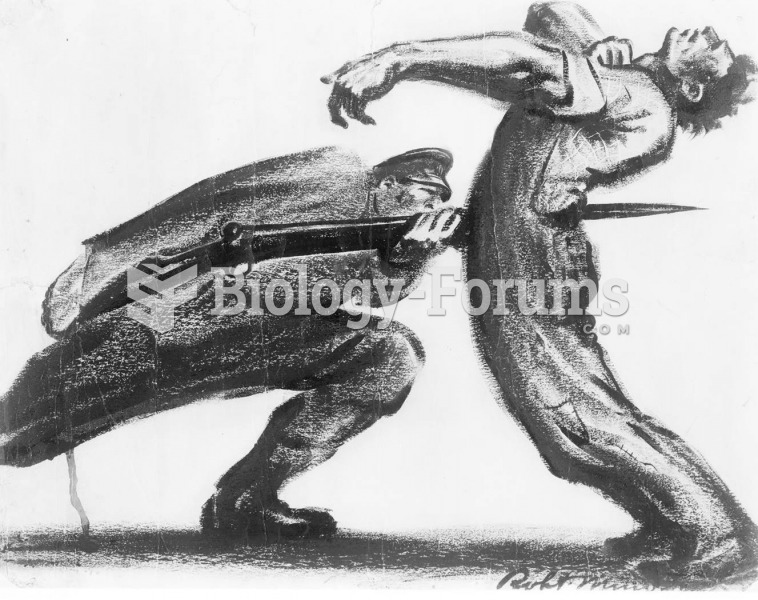 The Masses, a leading Socialist magazine, featured drawings by artists, including John Sloan, as wel
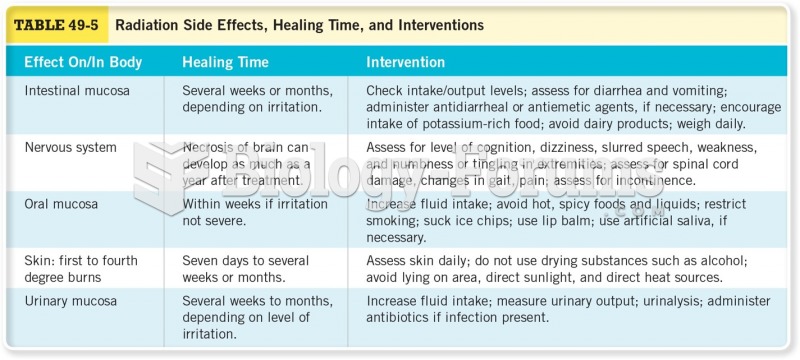 Radiation Side Effects, Healing Time, and Intervention
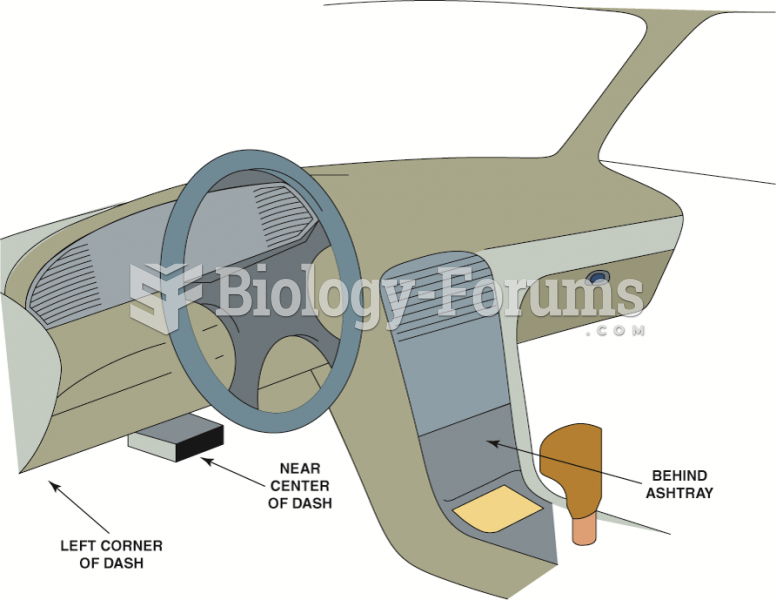 The data link connector (DLC) can be located in various locations.
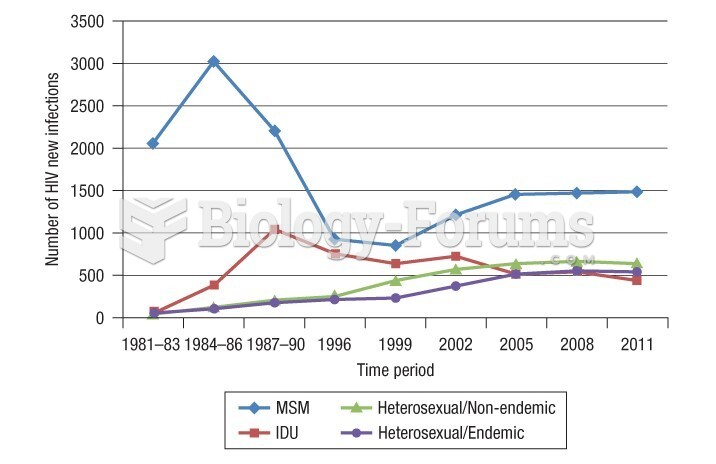 Estimated number of new HIV infections per year over time period in Canada
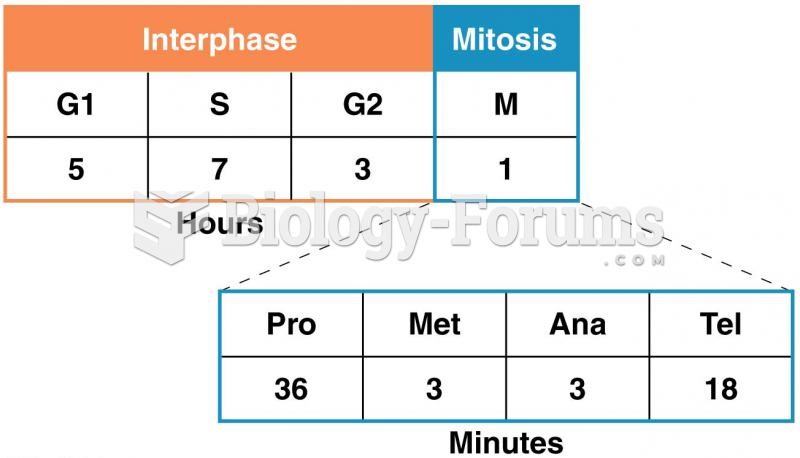 The time spent in each interval of one complete cell cycle of a human cell in culture