|
|
|

 Critical thinking involves analysis in which the nurse examines patient data available from a variet
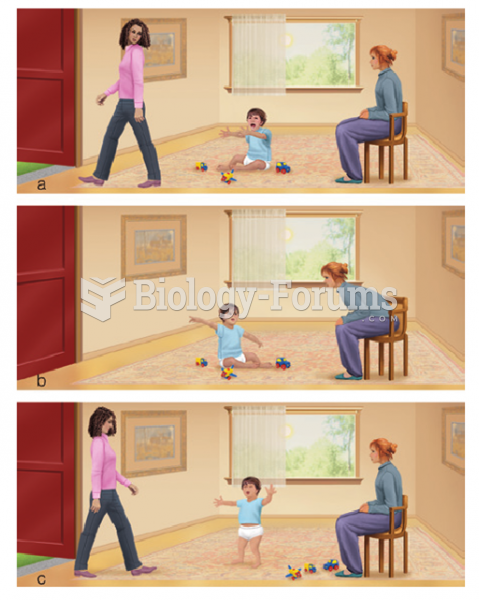 The strange situation. The Strange Situation features a series of episodes in which (a) the mother l
 Material Balance on Coolers in series
 How to find the quartiles and percentiles for a data set
 Greet a First-Time Client With a Firm Handshake.
 Increased amounts of "screen time" are contributing to decreased amounts of physical ...