This topic contains a solution. Click here to go to the answer
|
|
|

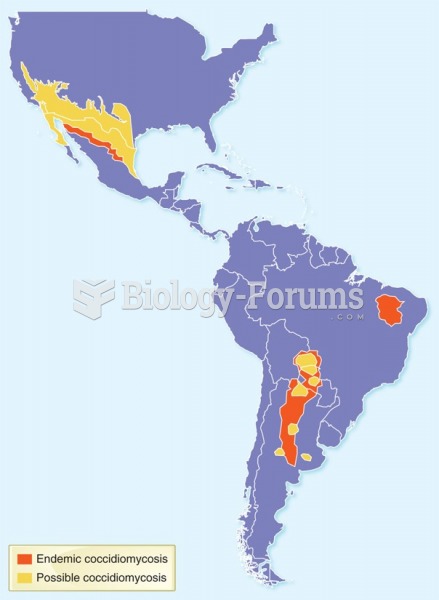 Geographic distribution of coccidiomycosis.
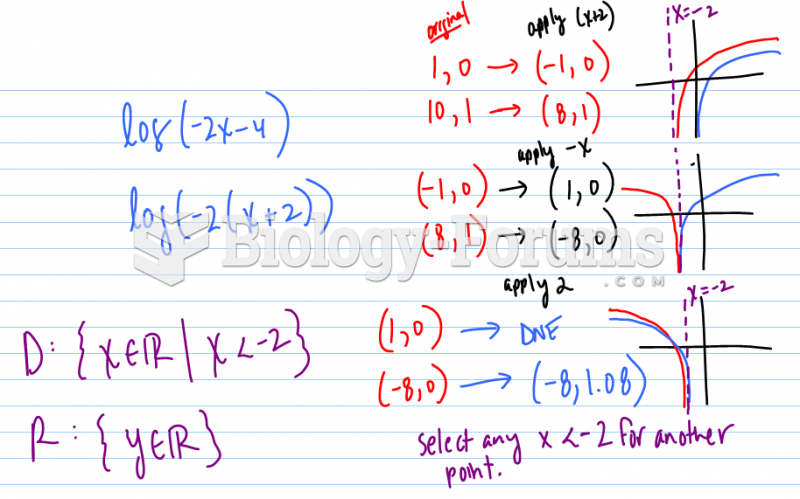 Sketch the graph of each function using transformations. State the domain and range.
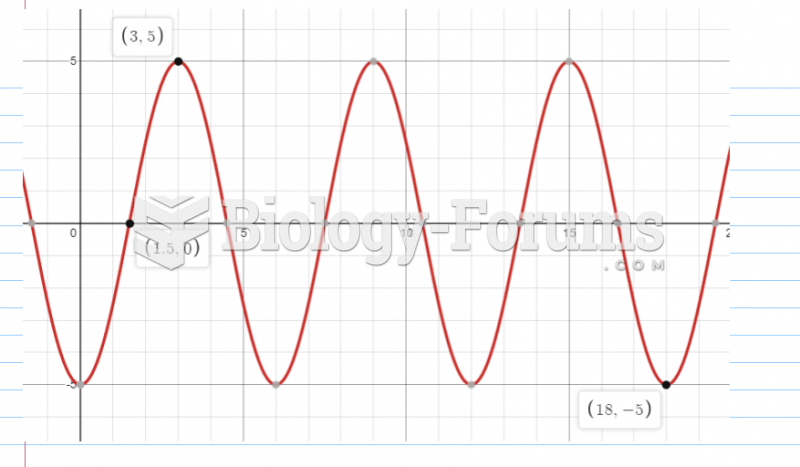 Sketch a graph of the function h(x), by hand on the following interval:
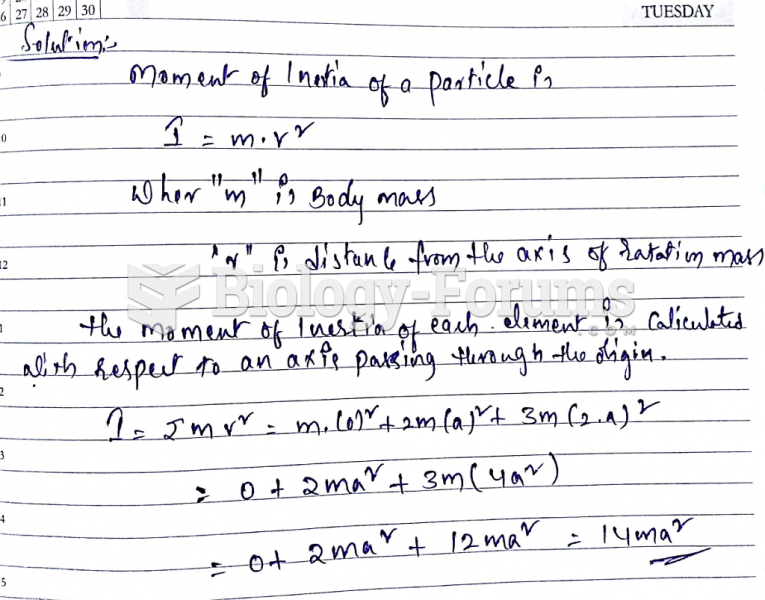 A triatomic molecule is oriented as follows along the x-axis: atom 1 of mass m is at the ...
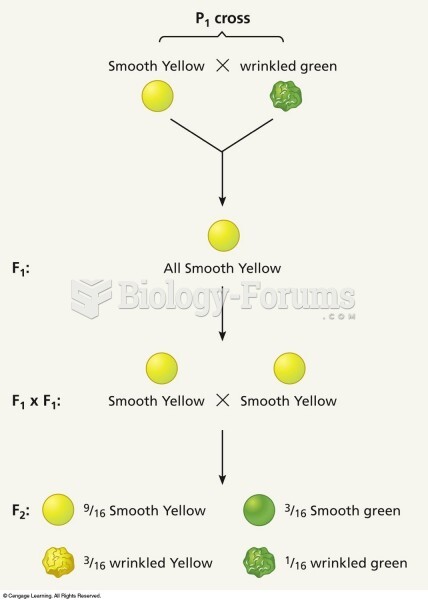 The phenotypic distribution in a cross with two traits: seed color and seed shape. Plants in the F2
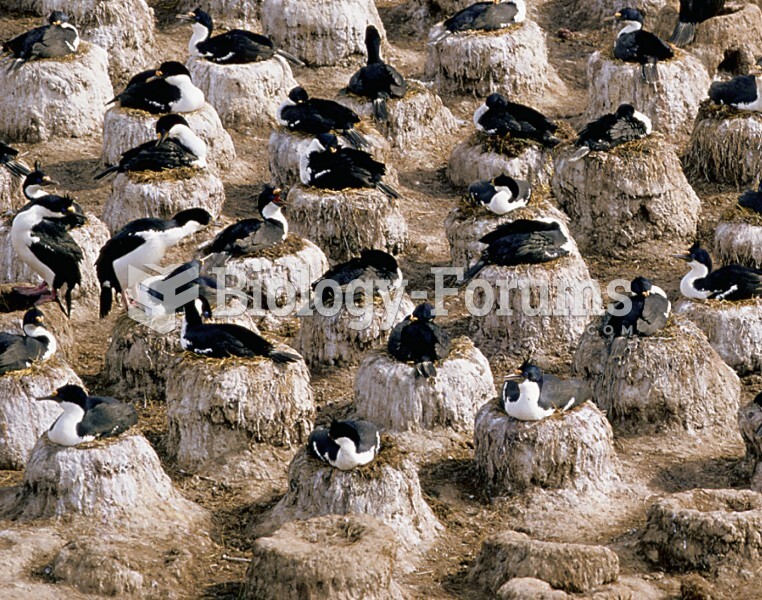 Near-uniform distribution of nesting seabirds