This topic contains a solution. Click here to go to the answer
|
|
|

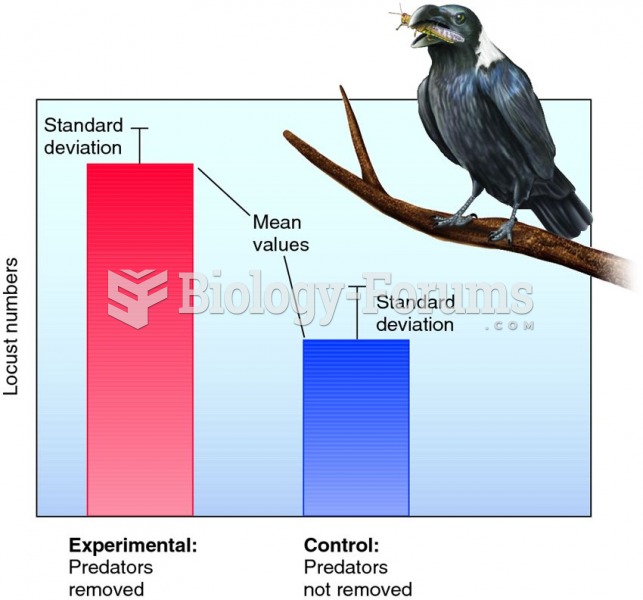 Graphic display of hypothetical results of a predator removal experiment.
 Bay (left) and chestnut (sometimes called "sorrel") are two of the most common coat colors
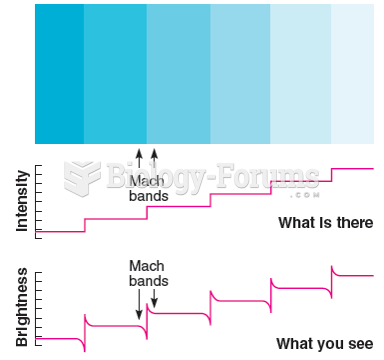 The illusory bands visible in this figure are often called Mach bands, although Mach used a ...
 Apply deep circular effleurage to the buttocks muscles as a warming technique. Place one hand on top ...
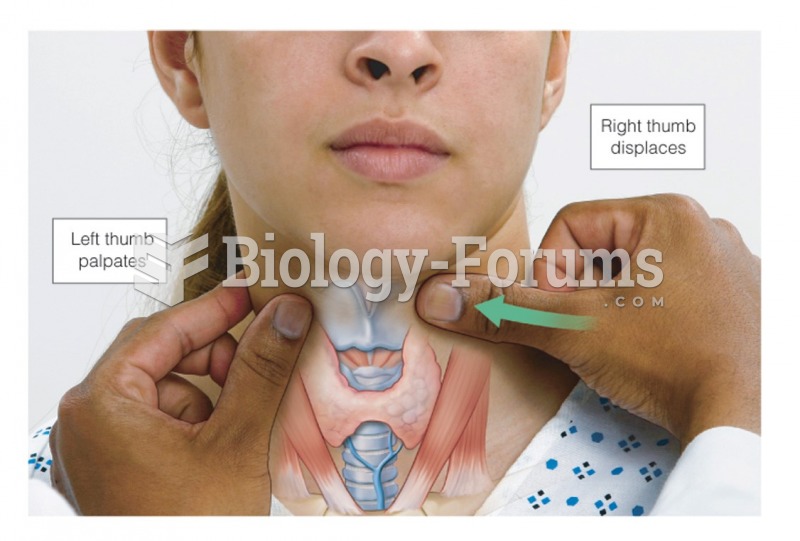 Alternative technique for palpating the thyroid
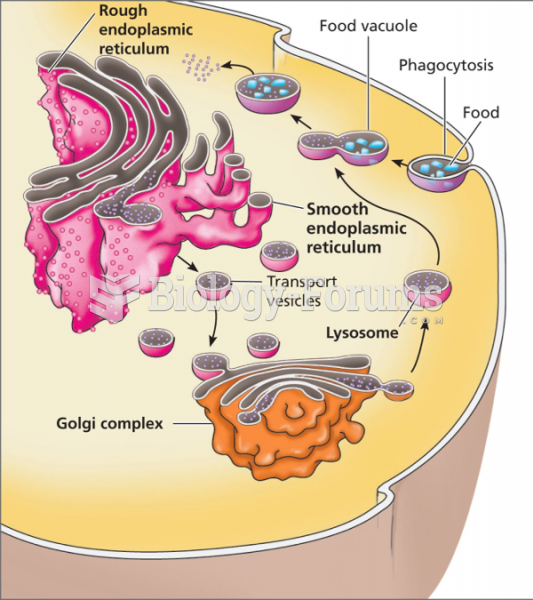 The relationship between the Golgi complex and lysosomes