|
|
|

 Guerrilla Girls. Do Women Have to Be Naked to Get into the Met. Museum?
 Infant and Toddler Development and Responsive Program Planning: A Relationship-Based Approach
 Number Facts
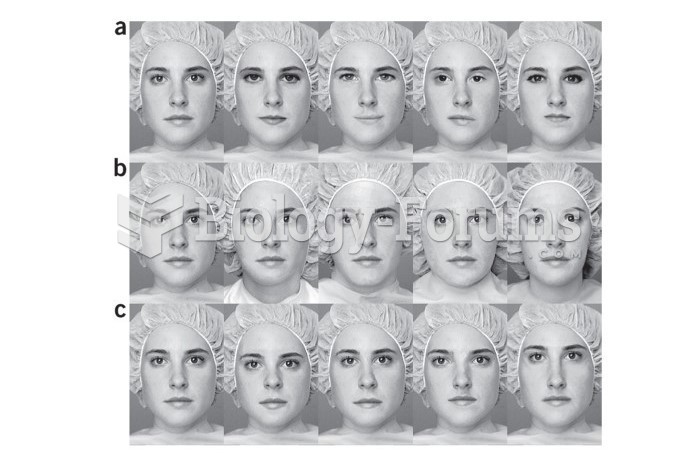 Sensitivity study for facial difference
 What is the total number of valence electrons in a silicate ion, SiO32-?