This topic contains a solution. Click here to go to the answer
|
|
|

Did you know?
Methicillin-resistant Staphylococcus aureus or MRSA was discovered in 1961 in the United Kingdom. It if often referred to as a superbug. MRSA infections cause more deaths in the United States every year than AIDS.

 Selected Hypothalamic and Pituitary Agents
 The b-galactosdase chart
 Functional Groups of Vitamin C
 Selected skeletal muscles and the Achilles tendon (posterior view).
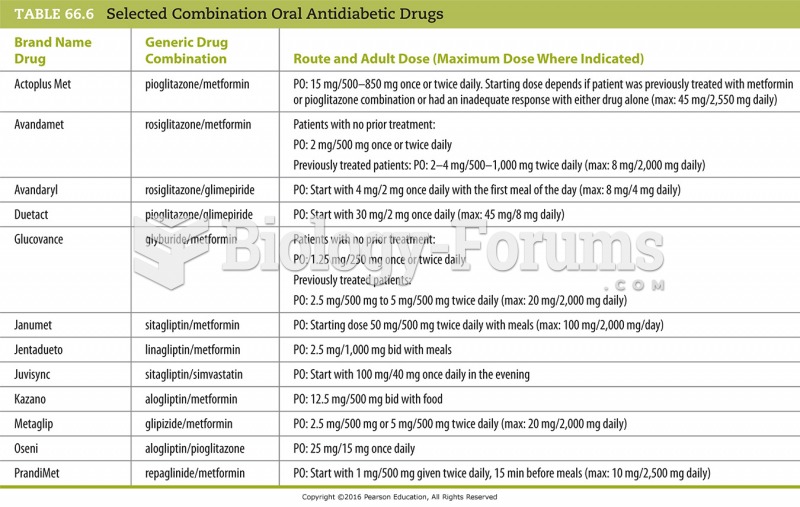 Selected Combination Oral Antidiabetic Drugs
 Selected Topical Corticosteroids for Dermatological and Oral Lesions