This topic contains a solution. Click here to go to the answer
|
|
|

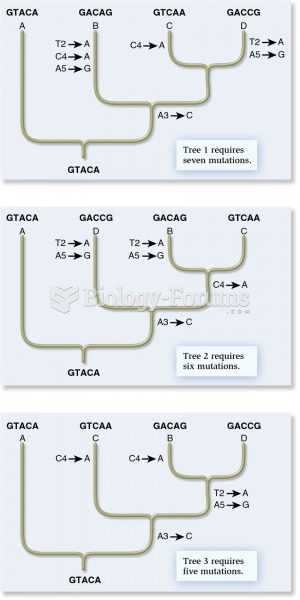 The cladistic approach from molecular genetic data
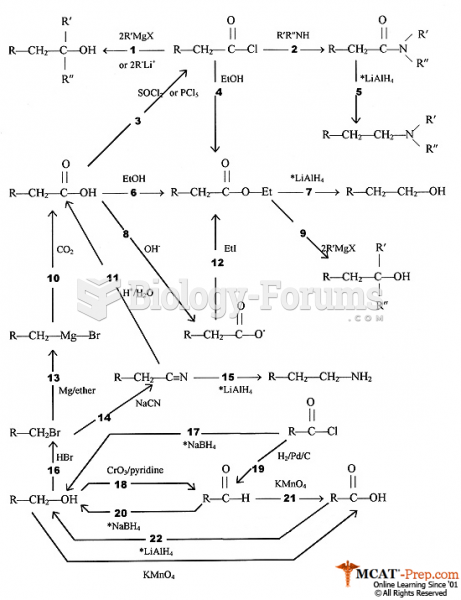 Organic Synthesis Flow Chart
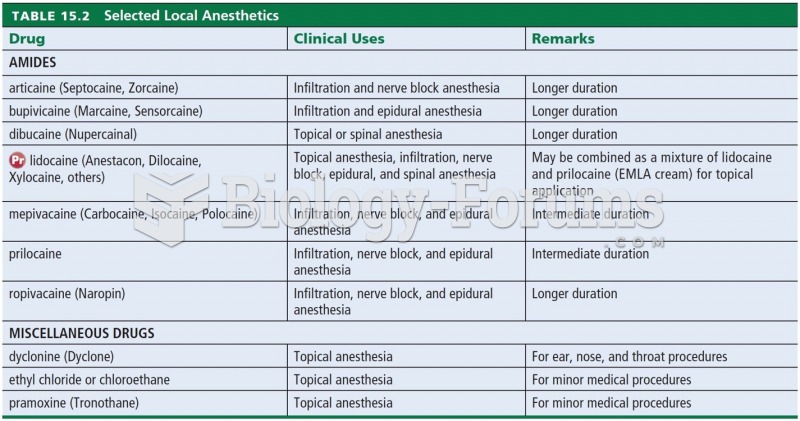 Selected Local Anesthetics
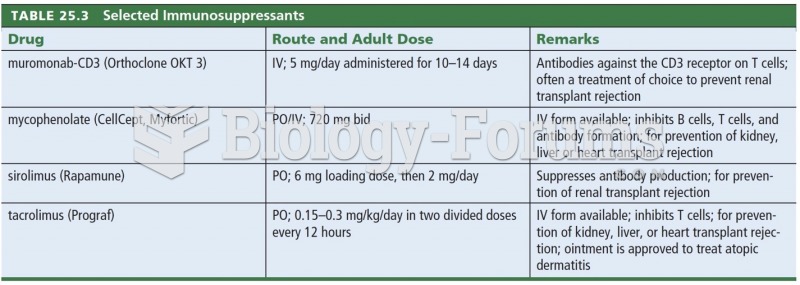 Selected Immunosuppressants
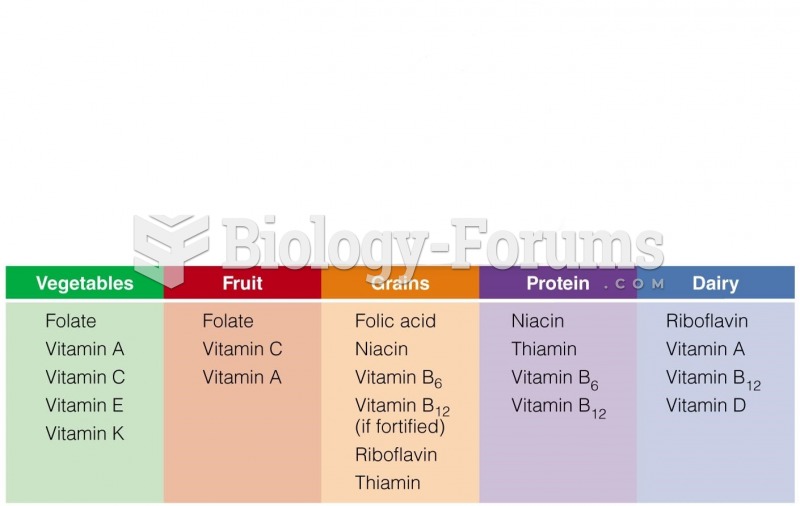 Vitamins Found Widely in the Food Groups
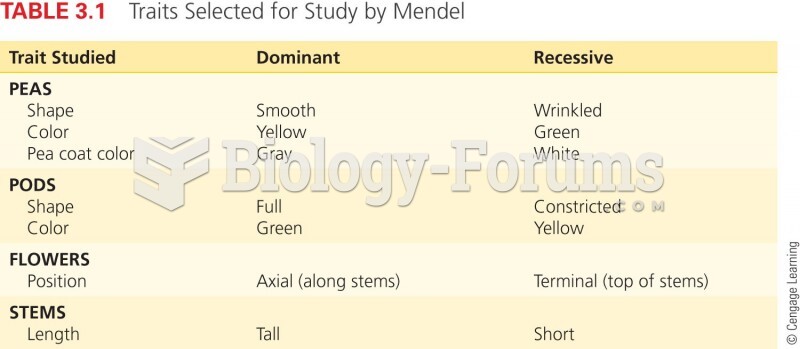 Traits Selected for Study by Mendel