This topic contains a solution. Click here to go to the answer
|
|
|

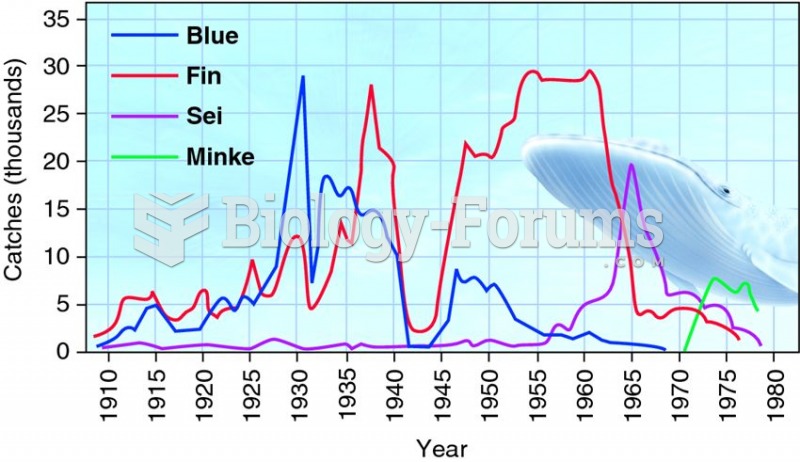 Sequential decline of whale catches in the Antarctic shows the strong effect of human predators.
 A farm family in Custer, Nebraska, in 1888, a region where Populist sentiment was strong.
 The cell wall of a Gram-positive bacterium, S. aureus
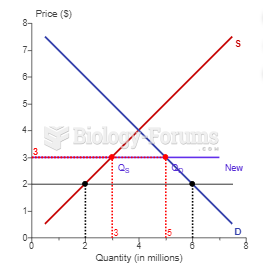 Suppose a country imports televisions. The country's supply and demand curves are shown in ...
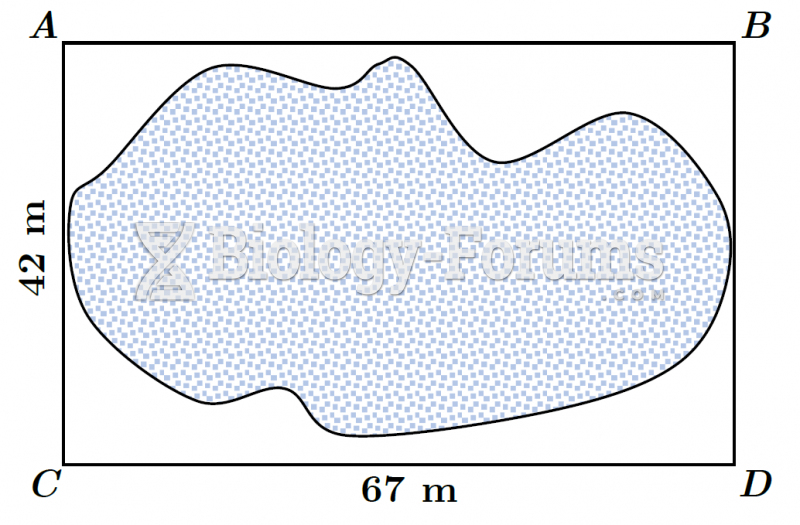 Plot of Land (Modified Offset Method) - Boxed