This topic contains a solution. Click here to go to the answer
|
|
|

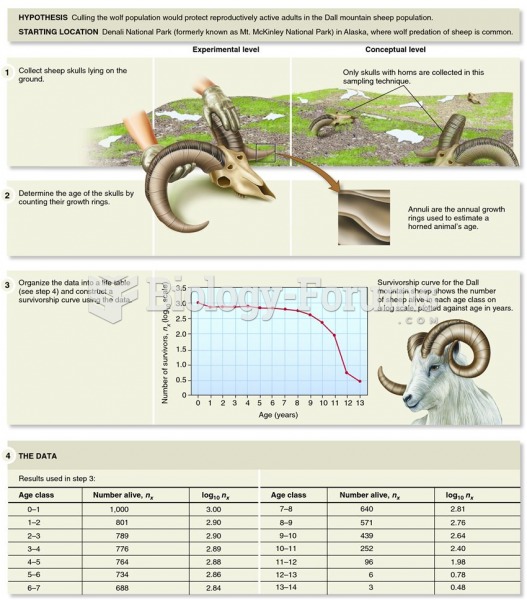 Examining the survivorship curve of a Dall mountain sheep population reveals information on the caus
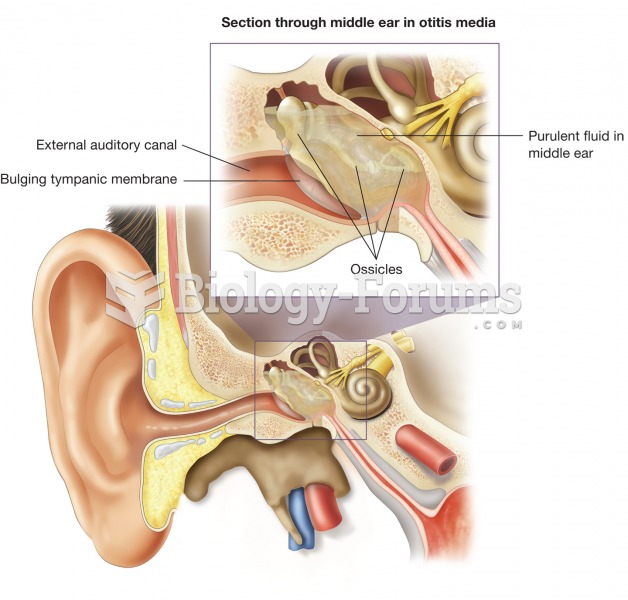 Otitis media. This illustration shows an inflamed tympanic cavity, which is the most common source o
 Localization of a Peptide The peptide is revealed by means of immunocytochemistry. The photomicrogra
 Connect a fused jumper wire to supply 12 volts to terminal 86 and a ground to terminal 85 of the ...
 Total Fertility Rate in Japan: Actual versus Forecast
 A 1000-kg car is slowly picking up speed as it goes around a horizontal unbanked curve whose ...