This topic contains a solution. Click here to go to the answer
|
|
|

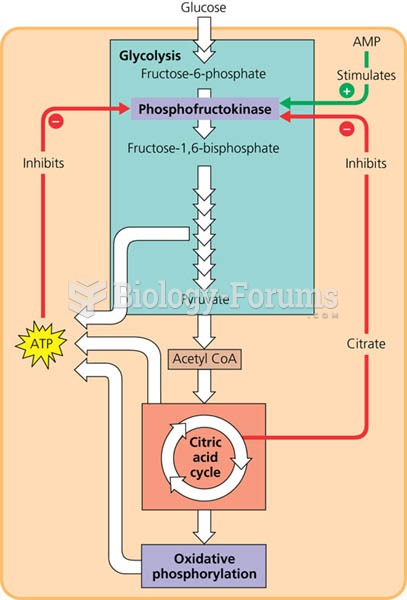 The control of cellular respiration
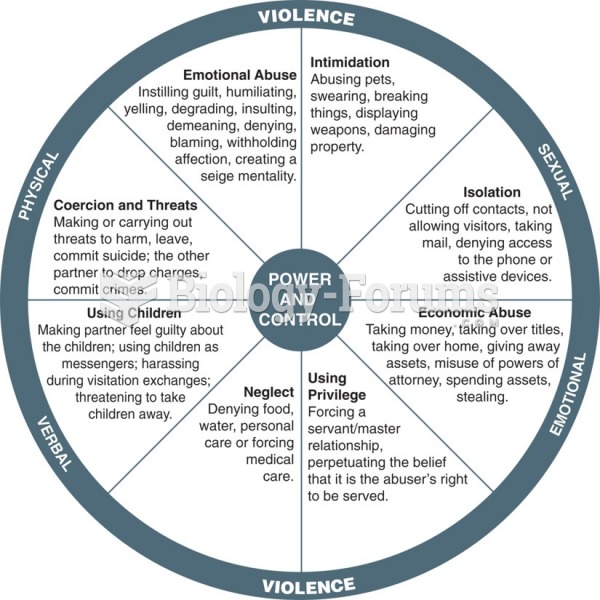 The power and control wheel illustrates the strategies that one partner may use to intimidate, ...
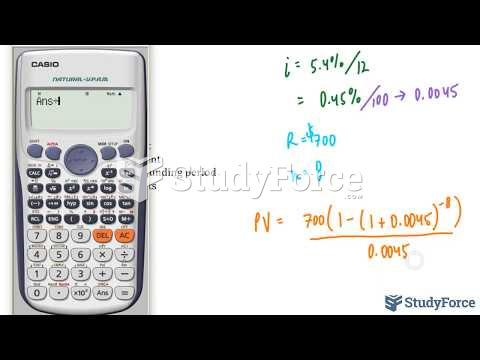 How to calculate present value (Question 1)
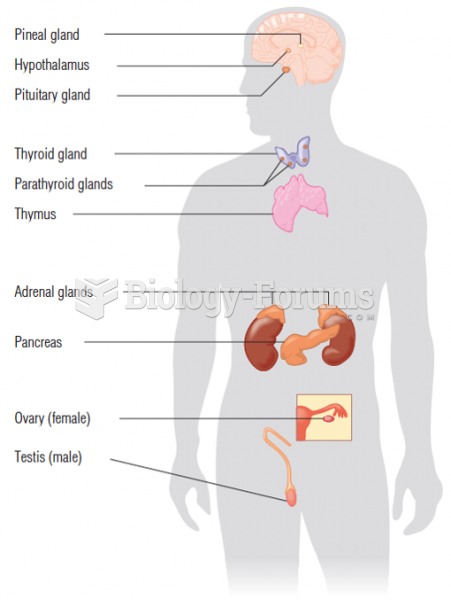 The major human endocrine glands and their central nervous system control centers
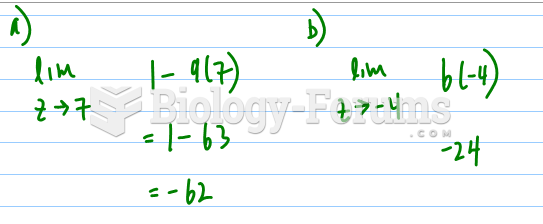 Evaluate the following limits, if they exist - Pt 2
 Alternative sigma factors for heat shock genes