Math self-efficacy can be defined as one's belief in his or her own ability to perform mathematical tasks. A college math professor wishes to find out if her students' math self-efficacy matches reality. To do this she gives a math quiz then asks her students to rate their level of confidence in how well they did on the quiz. She plans to test whether those who had little confidence that they did well on the quiz actually performed worse than those who had a high level of confidence that they did well on the quiz. Shown below is the approximate sampling distribution of the difference in mean quiz scores. The table below shows the summary statistics for the two groups. Assume that all conditions for a randomization test have been satisfied.


State the null and alternative hypothesis and also the value of the test statistic for the professor's randomization test.
◦ H
0: The typical quiz score for those with high confidence is the same as that of those with low confidence.
H
A: The typical quiz score for those with high confidence is greater than that of those with low confidence.
The Test Statistic is -5.4.
◦ H
0: The typical quiz score for those with high confidence is the same as that of those with low confidence.
H
A: The typical quiz score for those with high confidence is greater than that of those with low confidence.
The Test Statistic is 1.2.
◦ H
0: The typical quiz score for those with high confidence is greater than that of those with low confidence.
H
A: The typical quiz score for those with high confidence is the same as that of those with low confidence.
The Test Statistic is 5.4.
◦ H
0: The typical quiz score for those with high confidence is the same as that of those with low confidence.
H
A: The typical quiz score for those with high confidence is greater than that of those with low confidence.
The Test Statistic is 5.4.

 Electroencephalography (EEG). To perform the EEG, electrodes attached to the patient’s head pick up
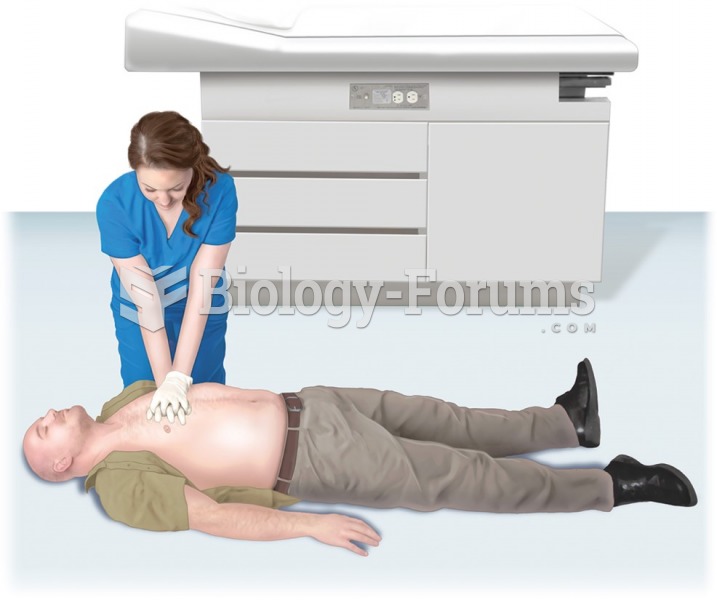 Perform Adult Rescue Breathing and One-Rescuer or Two-Rescuer CPR
 Medical assistants who perform billing must know and use the proper codes to ensure third-party ...
 How to perform the substitution rule with integrals (Part 2)
 this is a math question
 Math question