This topic contains a solution. Click here to go to the answer
|
|
|

 These bumper stickers show an allegiance to New Age religions
 Summary of US Census Data
 Children with insecure attachments may show angry behavior with peers, which can lead to peer ...
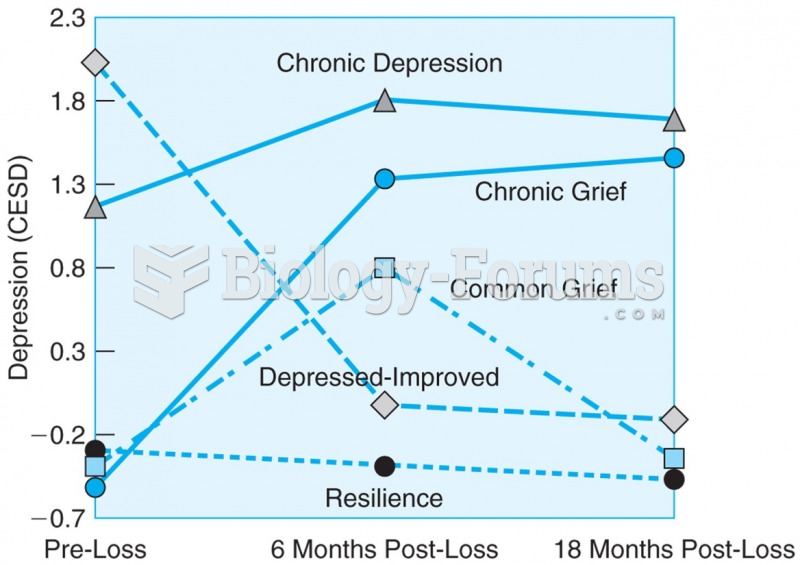 Bereaved spouses studied before loss, at the time of loss, and 18 months after loss show five ...
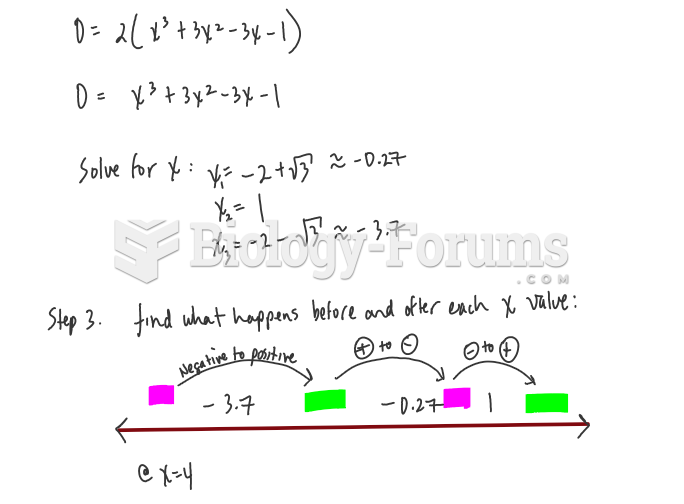 Calculus help: Show that y has three points of inflection and they all lie on...
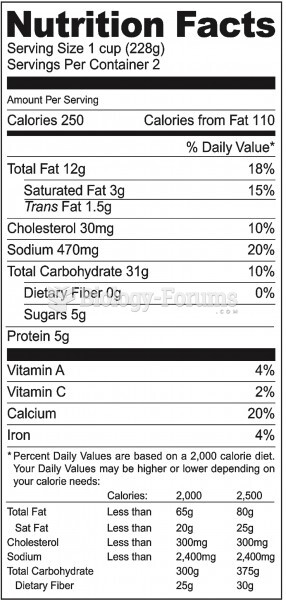 Food Labels Now Show Trans Fats