Which of the following graphical representations can be used most appropriately to show the distribution of a household's income, in terms of percentages, among the various categories of expenses?
A) A bar chart B) A time-series graph
C) A pie chart D) A histogram chart
Question 2
In the above figure, if initial equilibrium is at point A and there is a fully anticipated increase in aggregate demand from AD1 to AD2 due to an anticipated increase in the money supply, then
A) the price level will shift to P2 in the long run.
B) the economy will move directly from point A to point C without passing through point B.
C) the price level will shift to P2 in the short run.
D) the economy will move directly from point A to point B, and will remain at point B in the long run.

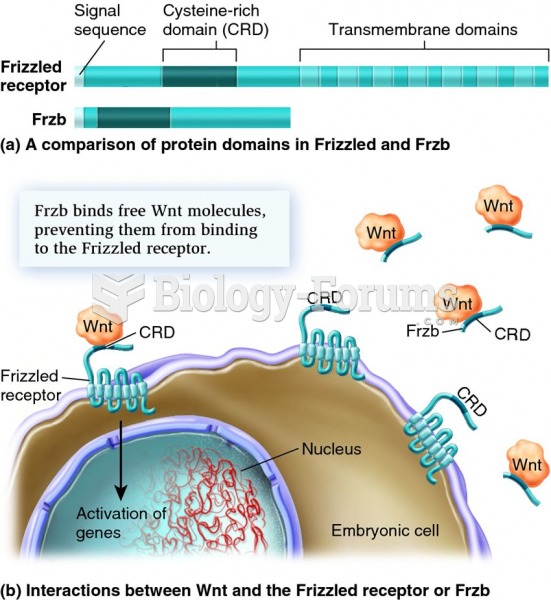 The actions of Frzb and the Frizzled receptor protein show how embryonic development represents a ba
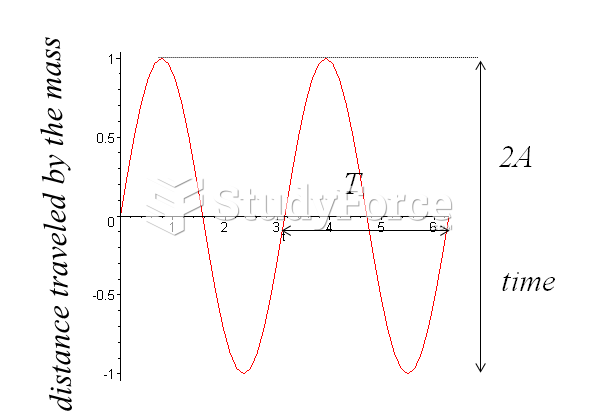 Graphical Representation of SHM
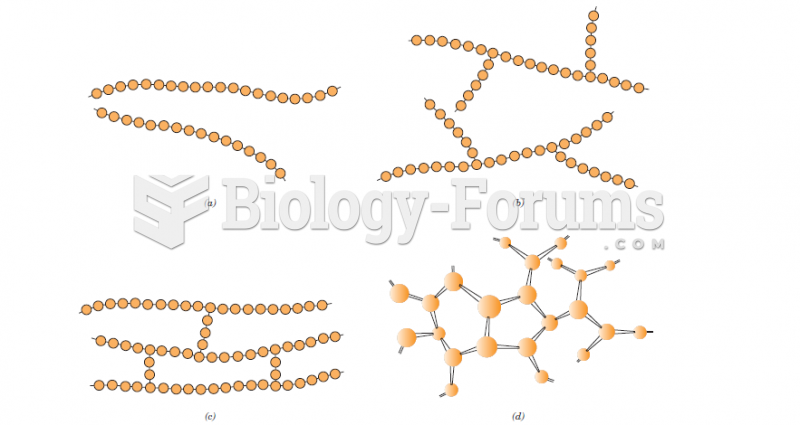 Schematic representations of (a) linear, (b) branched, (c) crosslinked, and (d) network (three-dimen
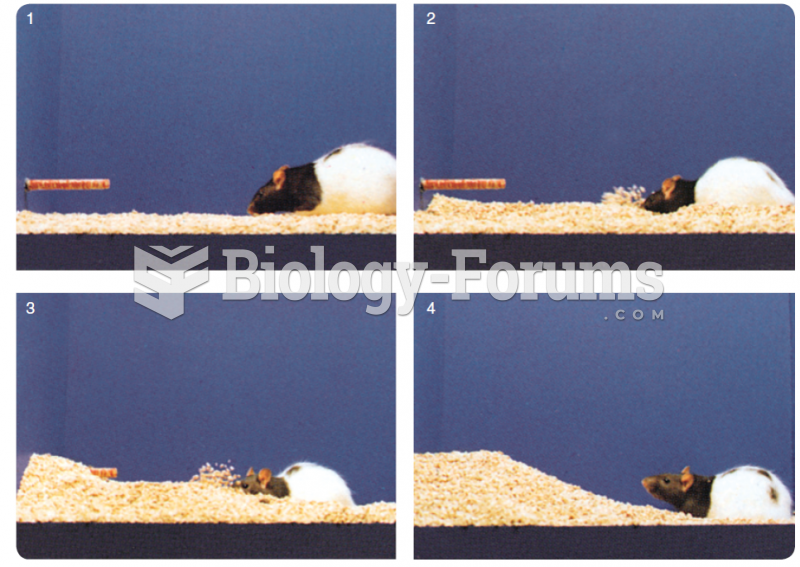 These photos show a rat burying a test object from which it has just received a single mild shock.
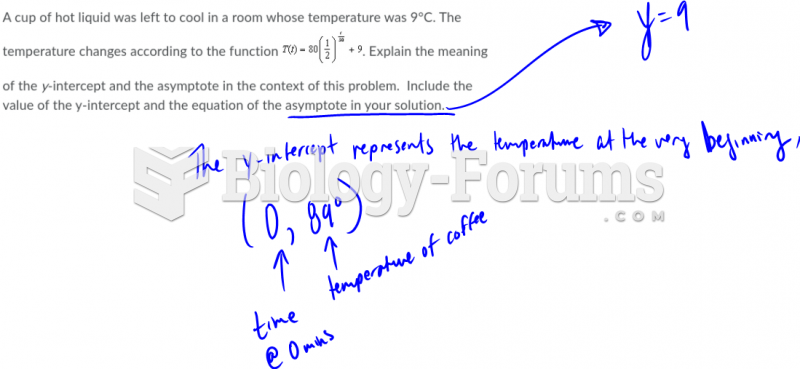 Please show all your work (4 marks)
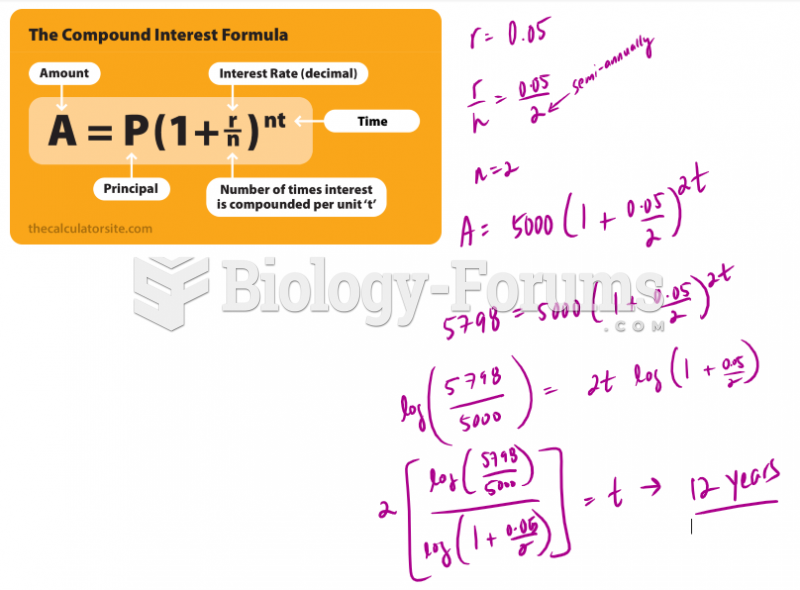 Use a graphical method to find the length of the loan to the nearest year