This topic contains a solution. Click here to go to the answer
|
|
|

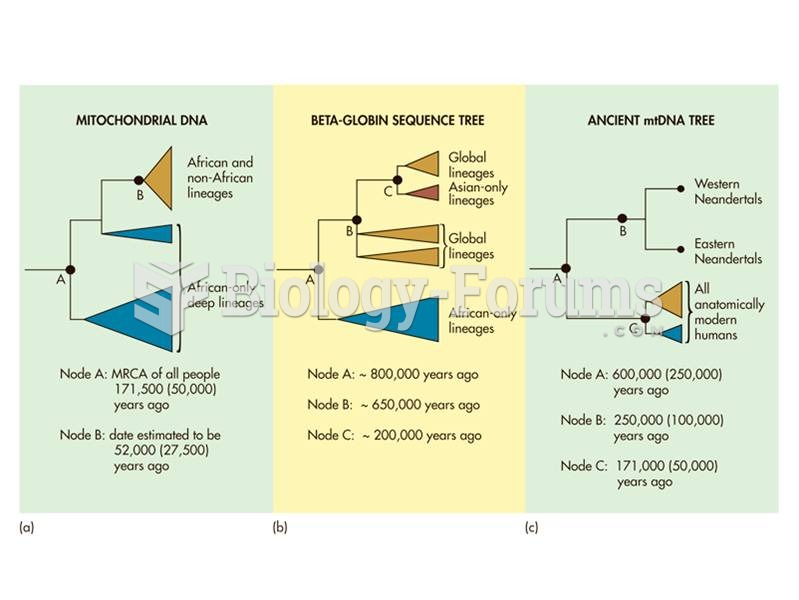 Three phylogenetic representations of modern human origins.
 Children with insecure attachments may show angry behavior with peers, which can lead to peer ...
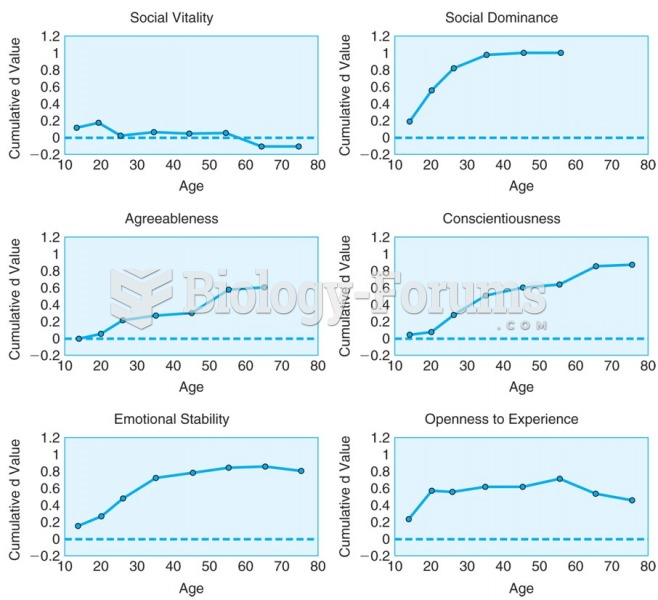 Cumulative change for six personality-trait domains across the life course show distinct patterns.
 How to solve word problems with two unknowns (Question 1)
 Physics - Motion (Please help me solve these problems, I really need help)
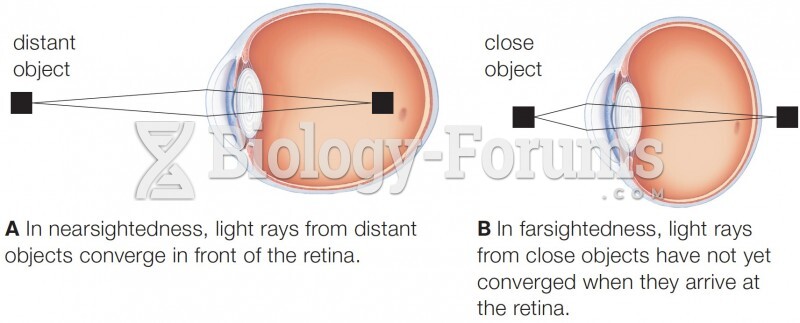 Focusing problems.