This topic contains a solution. Click here to go to the answer
|
|
|

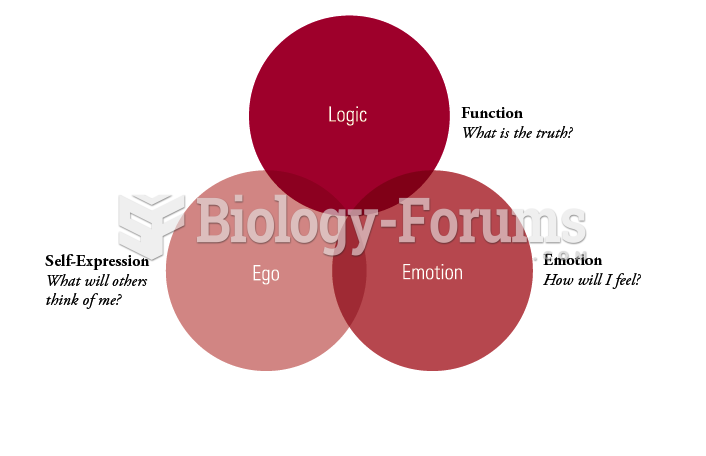 Decision Making
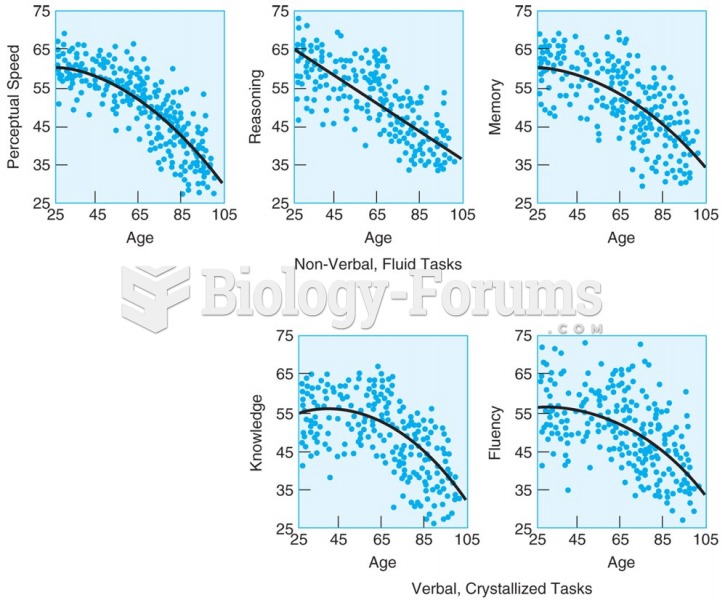 Adults in the Berlin Study of Aging show earlier declines on tests of nonverbal, fluid tasks (upper ...
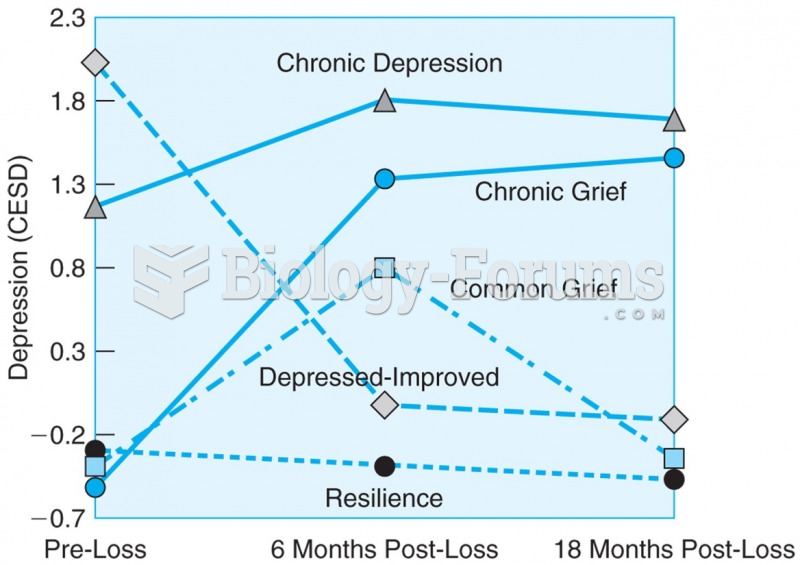 Bereaved spouses studied before loss, at the time of loss, and 18 months after loss show five ...
 How to solve optimization problems in calculus (Part 3)
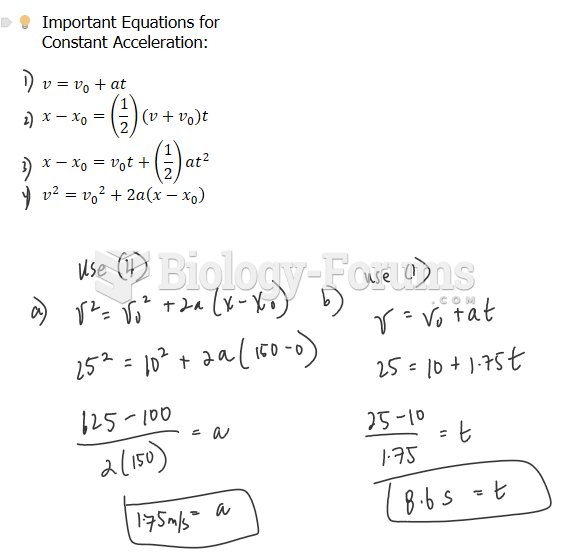 Physics - Motion (Please help me solve these problems, I really need help)
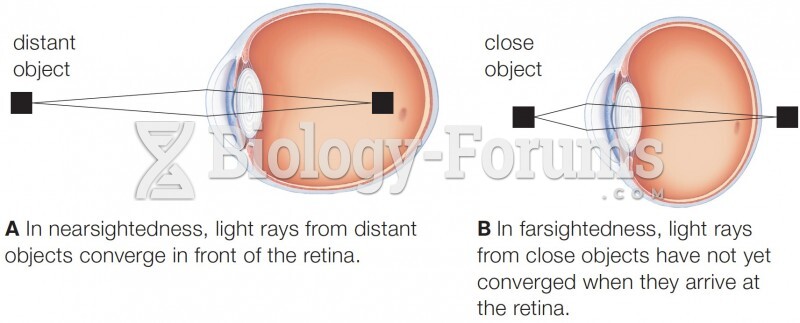 Focusing problems.