This topic contains a solution. Click here to go to the answer
|
|
|

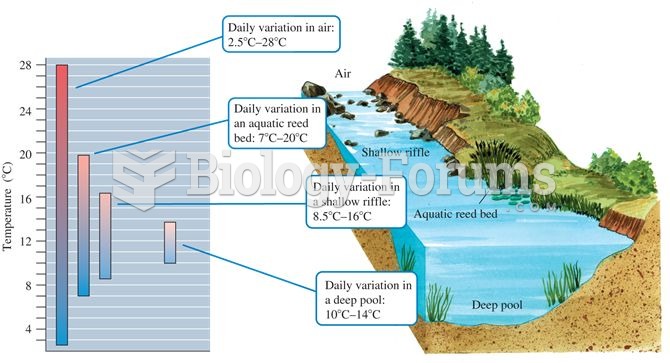 Aquatic microclimates: aquatic environments generally show less temperature variation compared to te
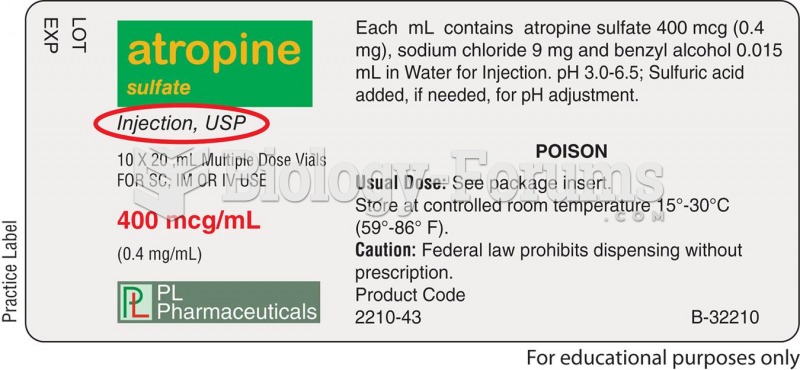 Some drug labels show the USP symbol; others do not.
 Children with insecure attachments may show angry behavior with peers, which can lead to peer ...
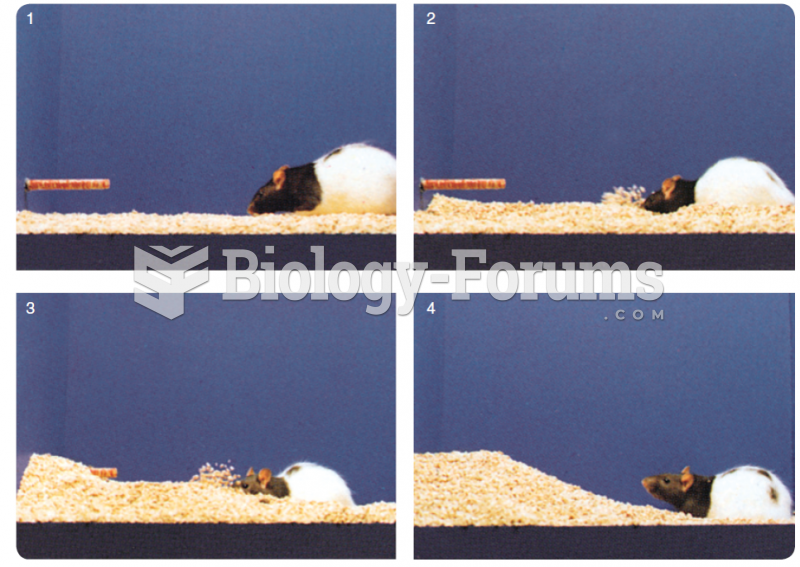 These photos show a rat burying a test object from which it has just received a single mild shock.
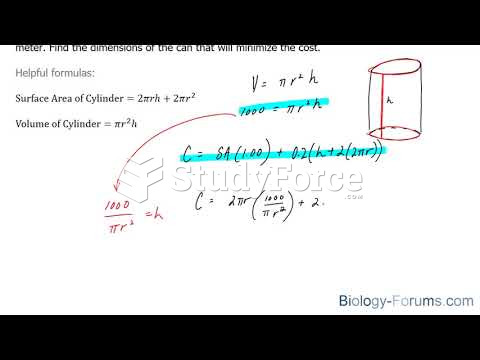 How to solve optimization problems in calculus (Part 3)
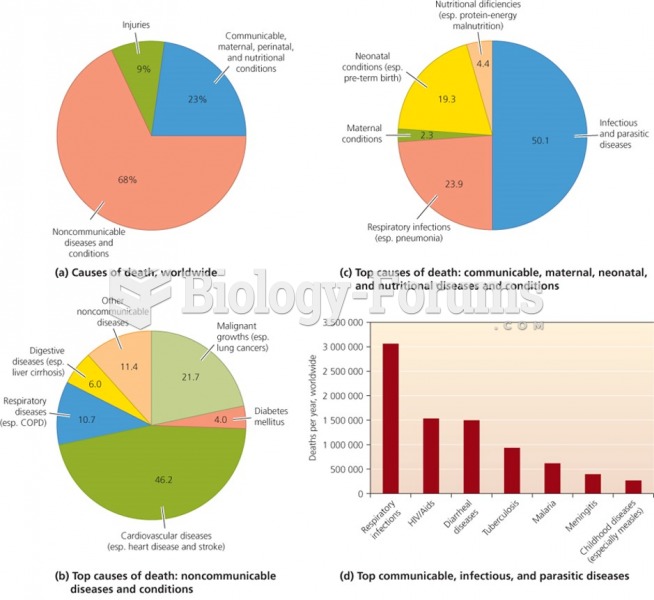 Disease: Major environmental health problems