This topic contains a solution. Click here to go to the answer
|
|
|

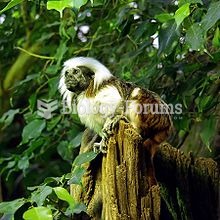 Geoffroy's tamarin has been considered a subspecies of the similar cottontop tamarin, shown abo
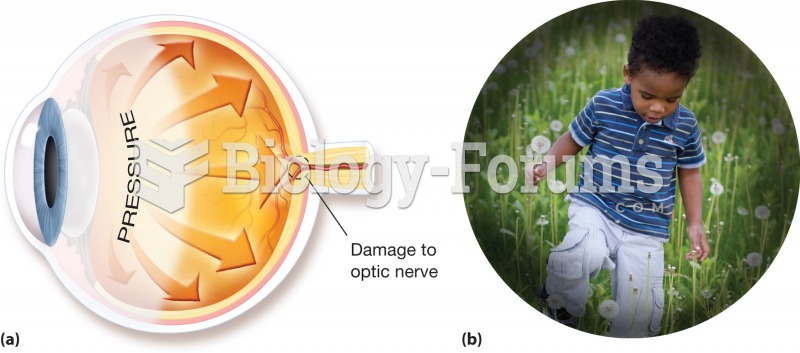 Glaucoma. (a) A buildup of pressure within the eye cavities, often caused by a blockage of vessels t
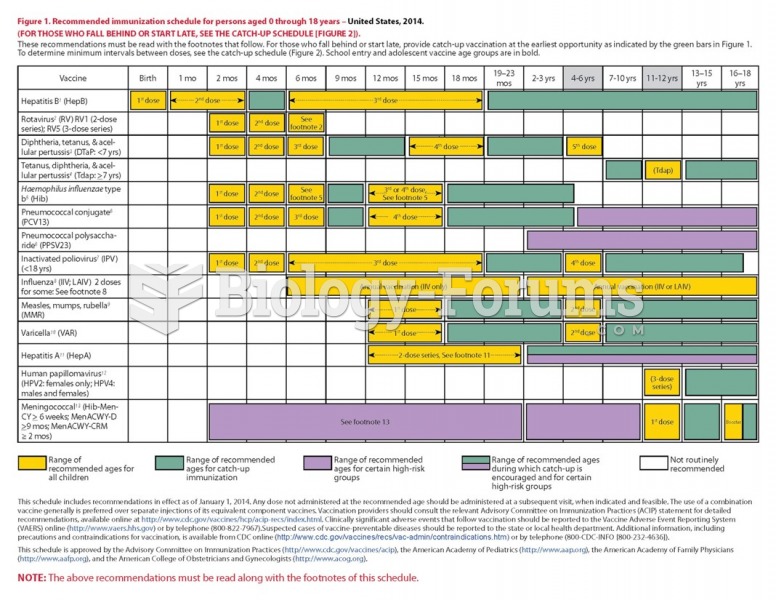 Recommended childhood and adolescent immunization schedule, 2009.
 States that require licensing or certification. Graphic provided by Associated Bodywork & ...
 Viruses, such as the hepatitis B virus shown here, need a host to survive and multiply
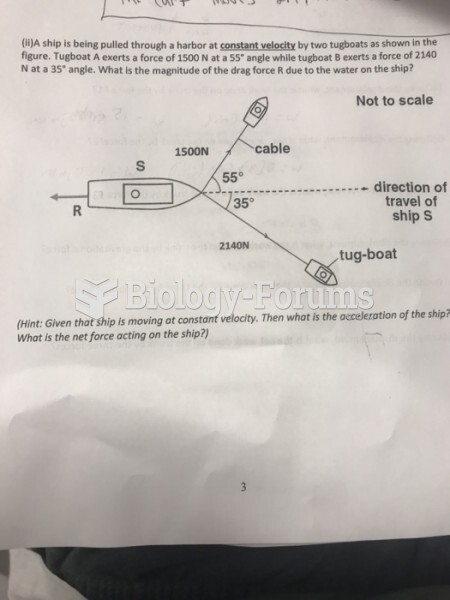 A ship is being pulled through a harbor at constant velocity by two tugboats as shown in the ...