Answer to Question 1
Answer: Common visual aids include tables, line charts, surface charts, bar charts, pictograms, scatter diagrams, flowcharts, diagrams, drawings, photographs, videos, and pie charts. A bar chart would be helpful for comparing the retail cost of several hybrid automobiles. (Answers will vary).Tables can display extensive amounts of data. Line charts illustrate trends over time or plot the relationship of two variables. A surface chart, also called an area chart, is a form of line chart that shows a cumulative effect; all the lines add up to the top line, which represents the total. Bar charts are useful for showing quantities over time. Pictograms are informational signs that convey ideas. Gantt charts expedite project management. Scatter and bubble diagrams are used to represent data points. Pie charts can show the frequency or distribution of parts of a whole.
Answer to Question 2
Answer: Yes, you should include it. Although you want to be as brief as possible, your readers need a minimum amount of information before they can grasp the issue being presented. Omitting relevant information or facts can bias your report.
Present all sides of the issue fairly and equitably and include all the essential information, even if some of the information doesn't support your line of reasoning. Omitting relevant information or facts can bias your report.

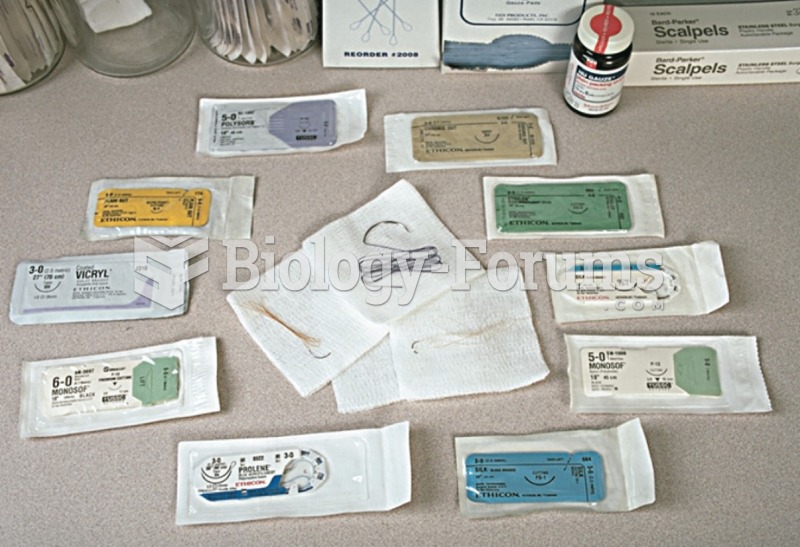 Types of suture material.
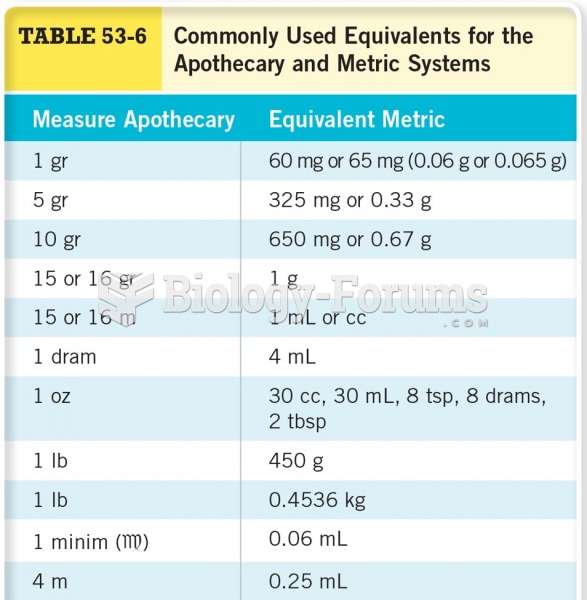 Commonly Used Equivalents for the Apothecary and Metric Systems
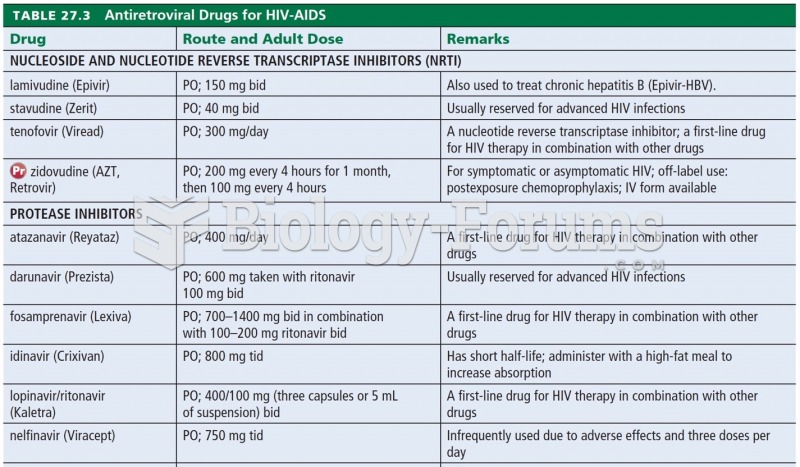 Antiretroviral Drugs for HIV-AIDS
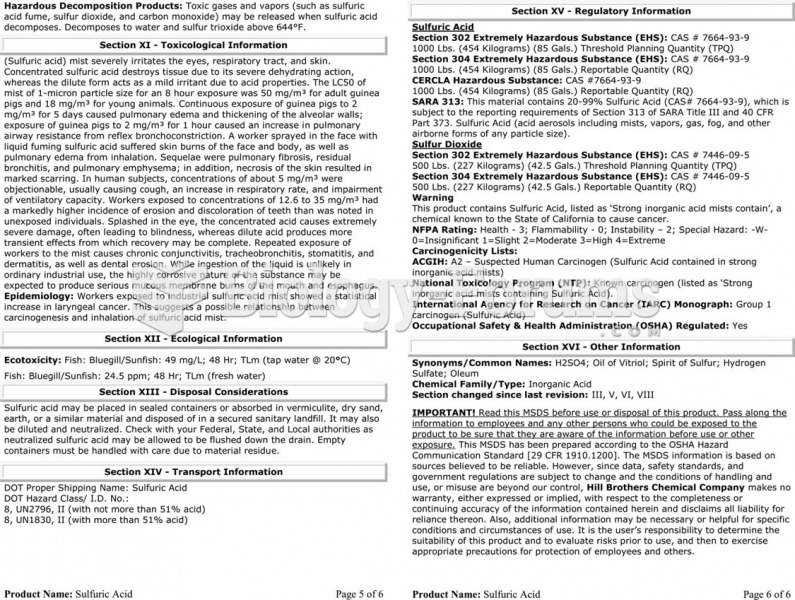
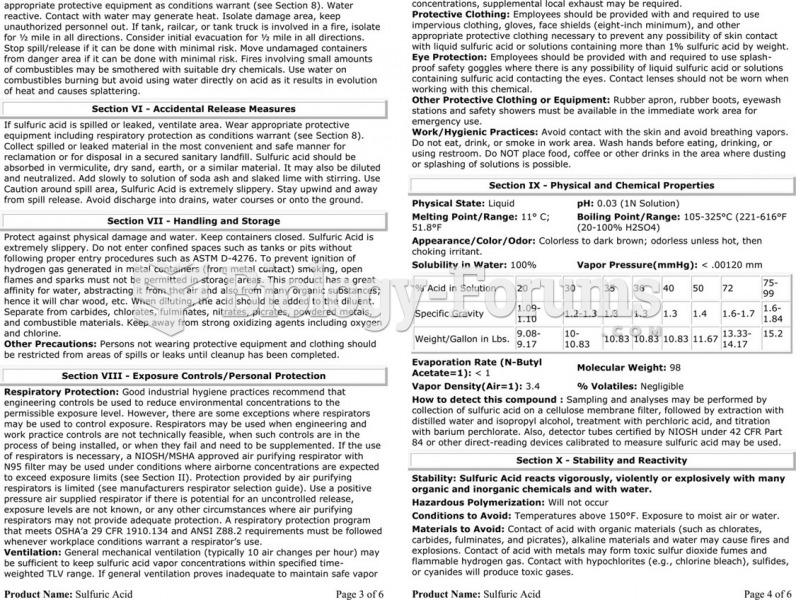 The material safety data sheet (MSDS) for sulfuric acid showing the detailed technical information ...
 The material safety data sheet (MSDS) for sulfuric acid showing the detailed technical information ...
 Types of cells involved in the inflammatory response