This topic contains a solution. Click here to go to the answer
|
|
|

 The Ames test for mutagenicity.
 Knee Reflex Test
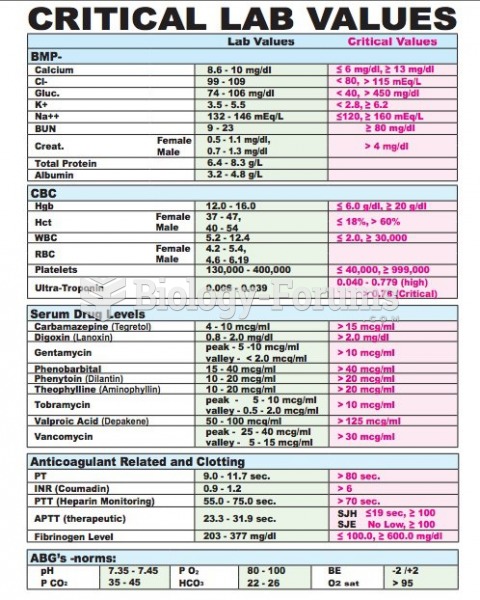 Critical lab Values
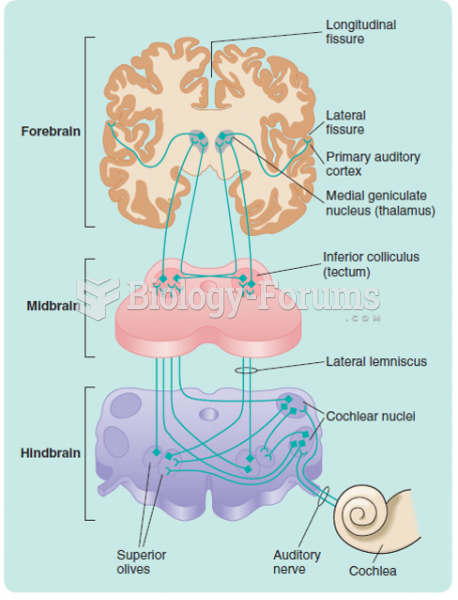 Some of the pathways of the auditory system that lead from one ear to the cortex.
 Mantoux tuberculin skin test.
 Finding the graph of a Parabola using certain values