This topic contains a solution. Click here to go to the answer
|
|
|

 The Green Pygmy Goose (Nettapus pulchellus) is a small perching duck which breeds in southern New Gu
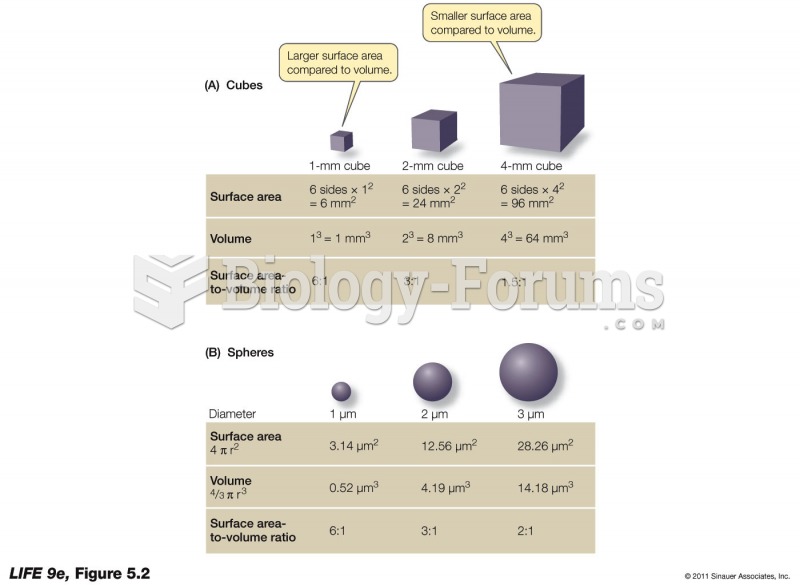 Why Cells Are Small
 The postoperative client supports an incision with a folded pillow when taking a deep breath and cou
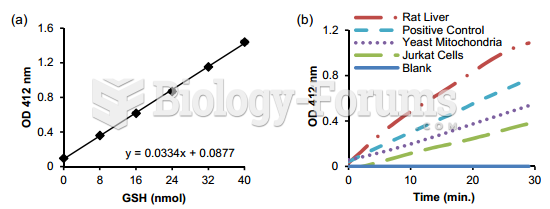 Citrate synthase test
 Heel-to-shin test
 Liver scratch test