This topic contains a solution. Click here to go to the answer
|
|
|

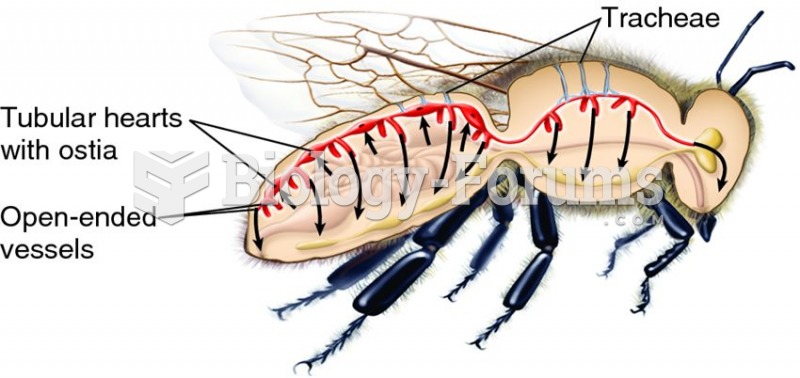 An open circulatory system.
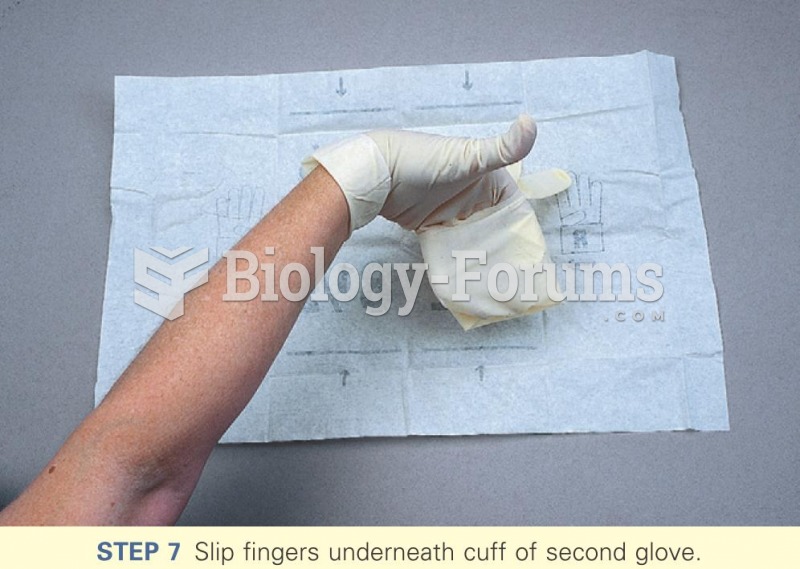 OPEN GLOVING 3
 For centuries, widows in the Mediterranean countries, such as thise widow in Greece, were expected ...
 Open pit mining creates immense holes at the surface
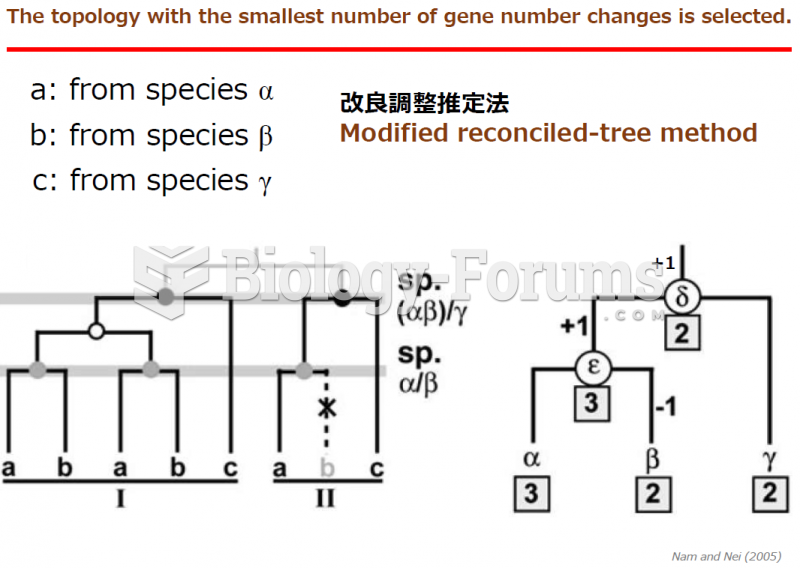
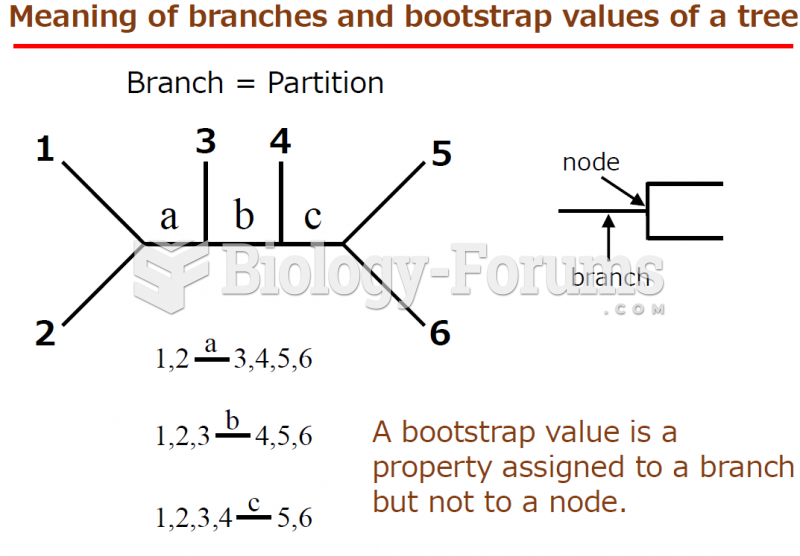 How to calculate the gain and loss gene numbers with low bootstrap of phylogenetic tree?
 How to calculate the gain and loss gene numbers with low bootstrap of phylogenetic tree?