This topic contains a solution. Click here to go to the answer
|
|
|

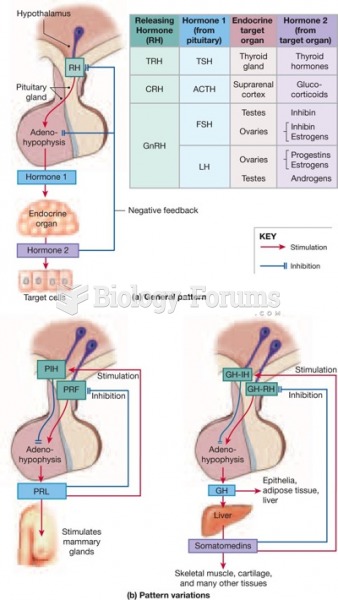 endocrine feedback control
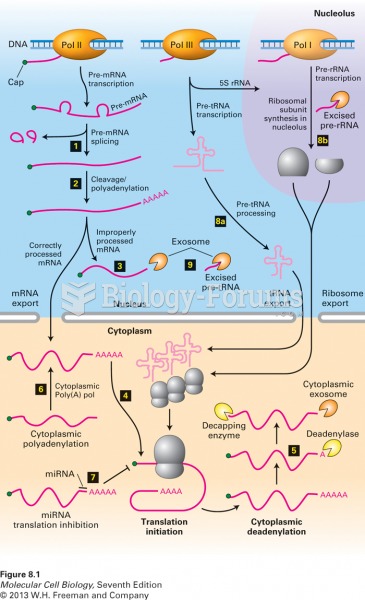 Overview of RNA processing and posttranscriptional gene control
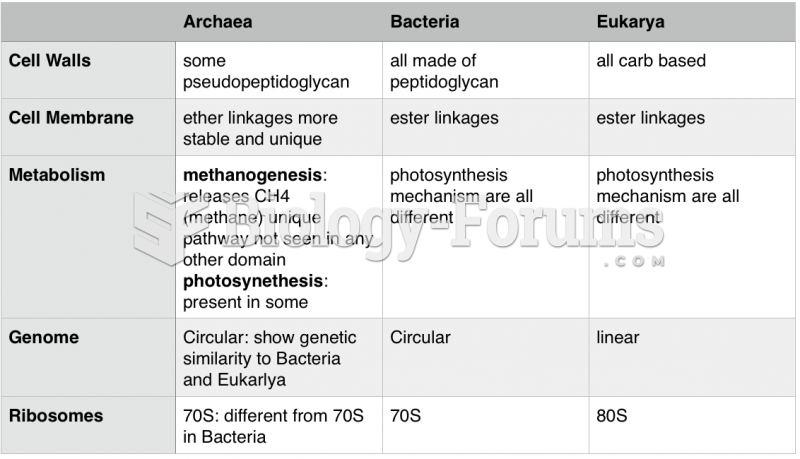 Archaea, Eukarya, Bacteria Differences Chart
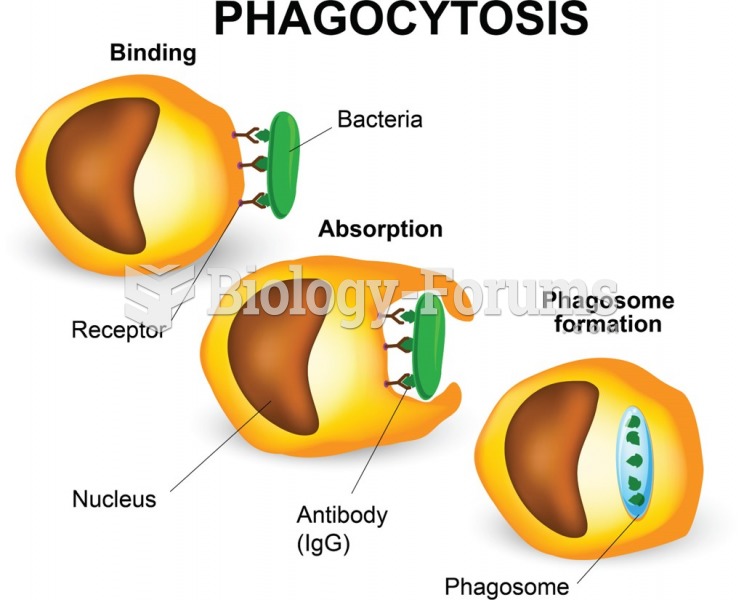 The process of phagocytosis: a phagocyte engulfing bacteria or other foreign material.
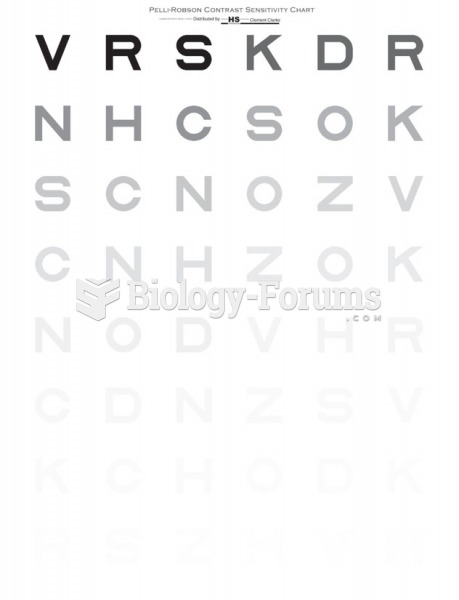 Pelli-Robson contrast sensitivity chart.
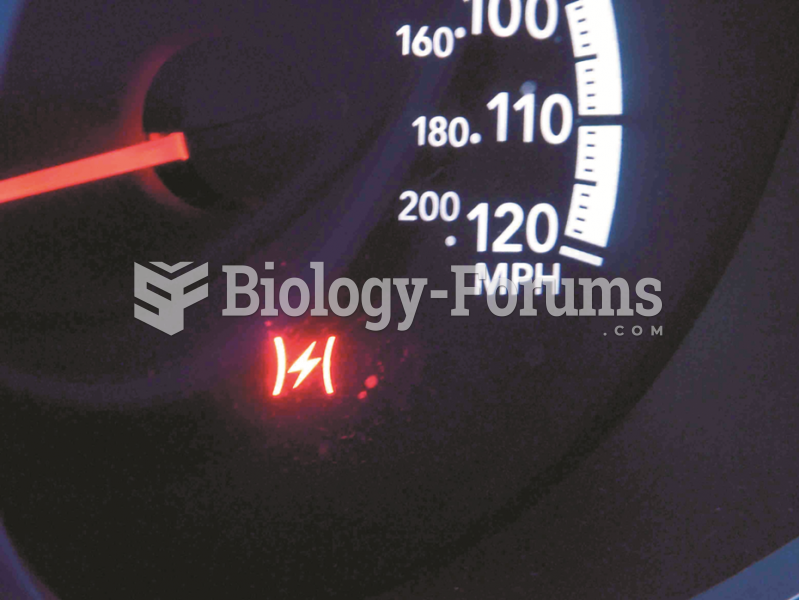 A symbol used on a Chrysler vehicle indicating a fault with the electronic throttle control.