|
|
|

 The Tsavo Man-Eaters on display in the Field Museum of Natural History in Chicago, Illinois.
 Ochem molecule contrast chart
 This chart illustrates the “drip down” model of government. In this, politics is formed by the soc
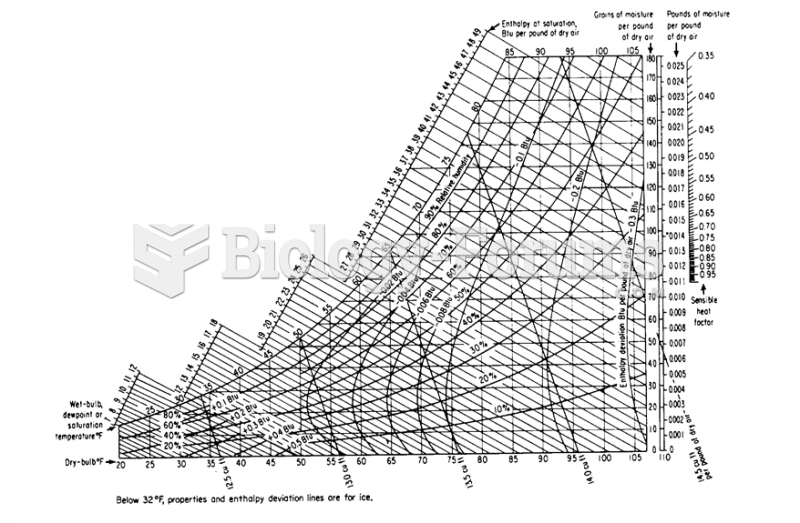 Humidity Chart
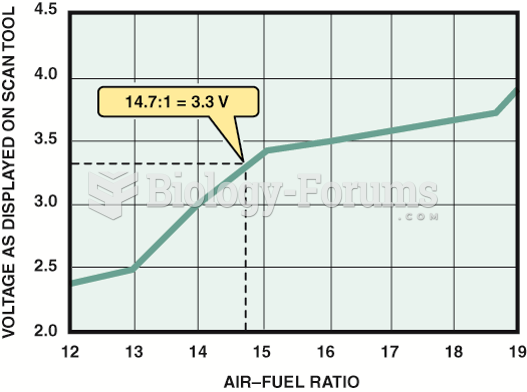 The scan tool can display various voltage but will often show 3.3 volts because the PCM is ...
 Chart showing average yearly dose of radiation from natural and human-made sources