This topic contains a solution. Click here to go to the answer
|
|
|

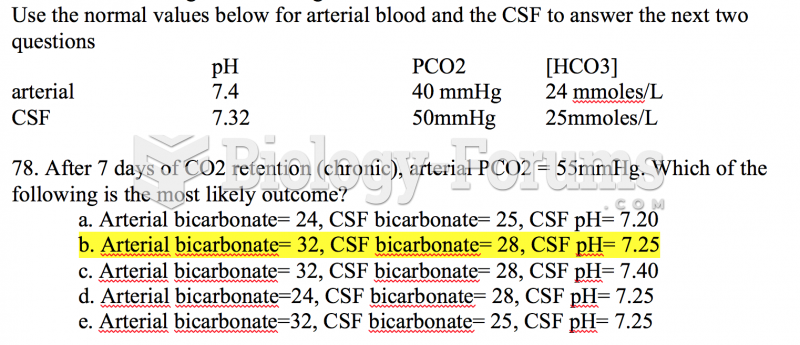 Respiratory Question
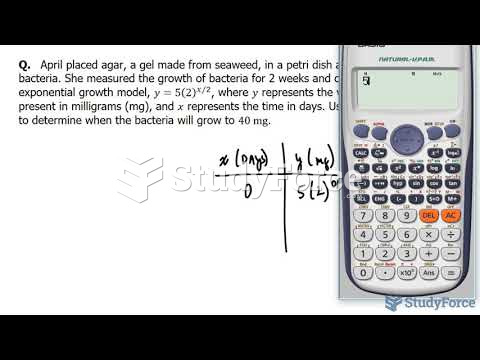 How to solve an exponential problem using a table of values (Question 2)
 Molecular Genetics DNA picture matching question
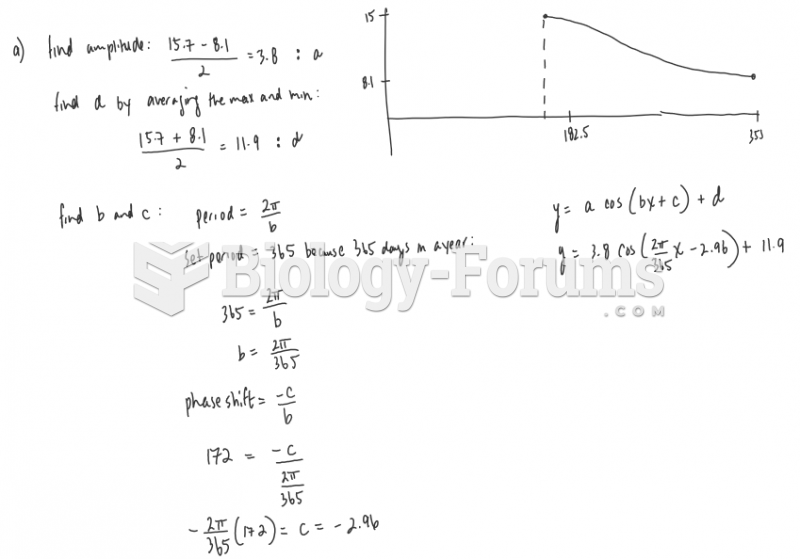 Functions application question
 economic question
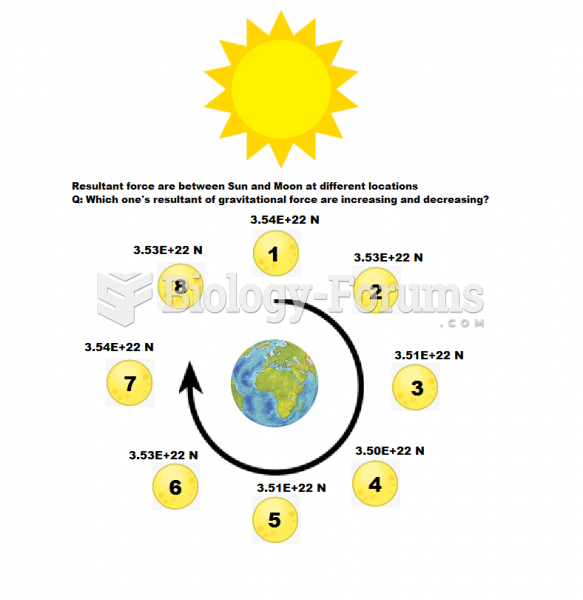 Question about Resultant of gravitational force?