This topic contains a solution. Click here to go to the answer
|
|
|

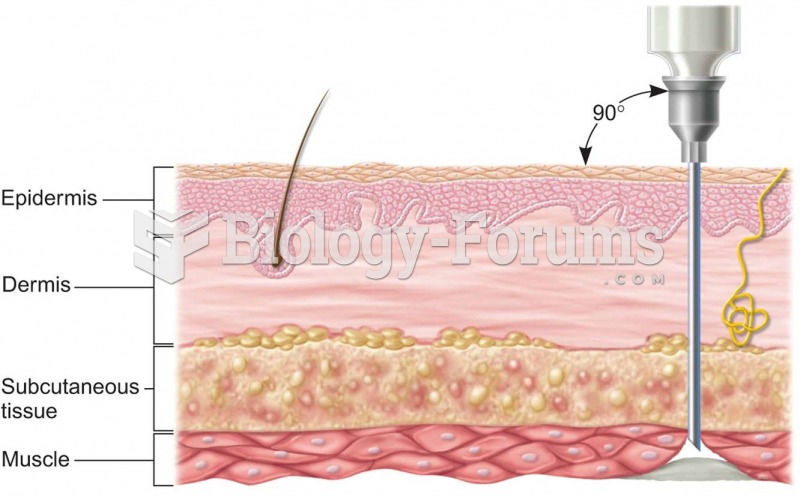 Intramuscular drug administration: (a) cross section of skin showing depth of needle insertion
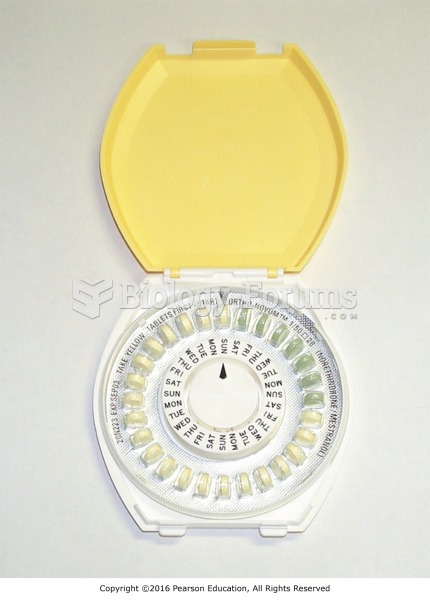 An oral contraceptive showing the daily doses and the different formulation taken in the last 7 days ...
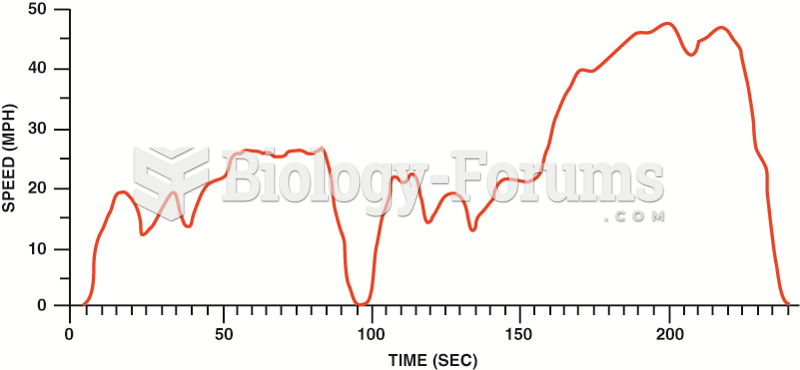 Trace showing the Inspection/Maintenance 240 test. The test duplicates an urban test loop around Los ...
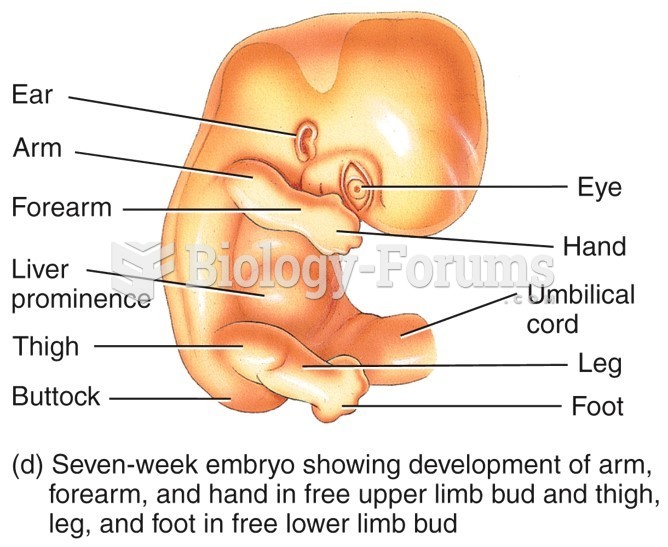 Seven-week embryo showing development of arm, forearm, and hand
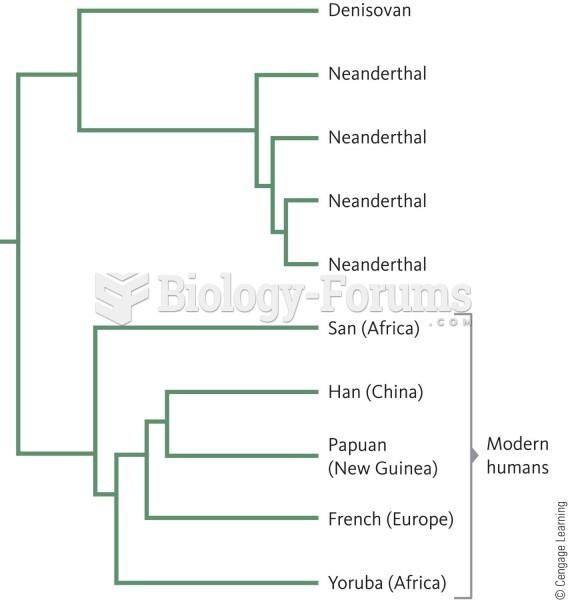 A phylogenetic tree showing that all non-African human populations share a closer genetic relationsh
 Famous People with Parkinson's Disease