This topic contains a solution. Click here to go to the answer
|
|
|

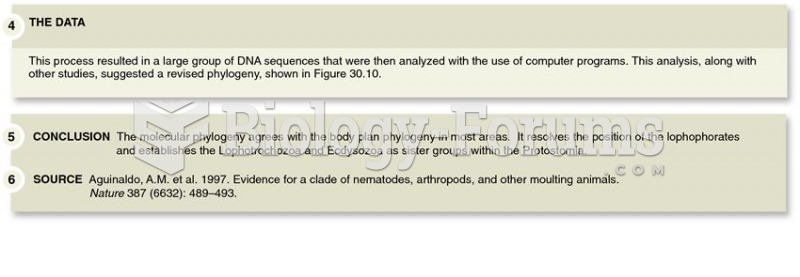 Approach used to determine the evolutionary relationships among many animal species using molecular
 Evaluation measures to determine the success of goals
 Tornado Formation: Supercell Tornado Development
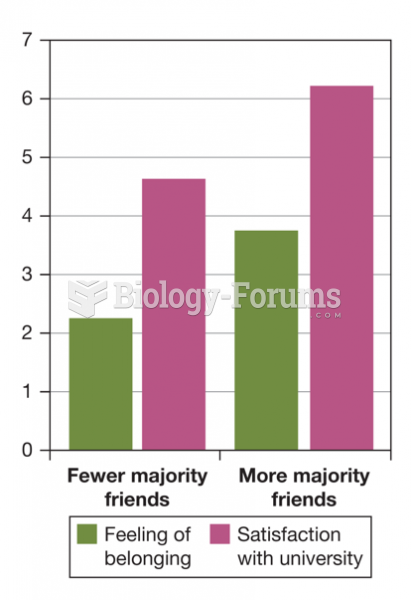 The Impact of Cross-Ethnic Friendships on Minority Students’ Well-Being
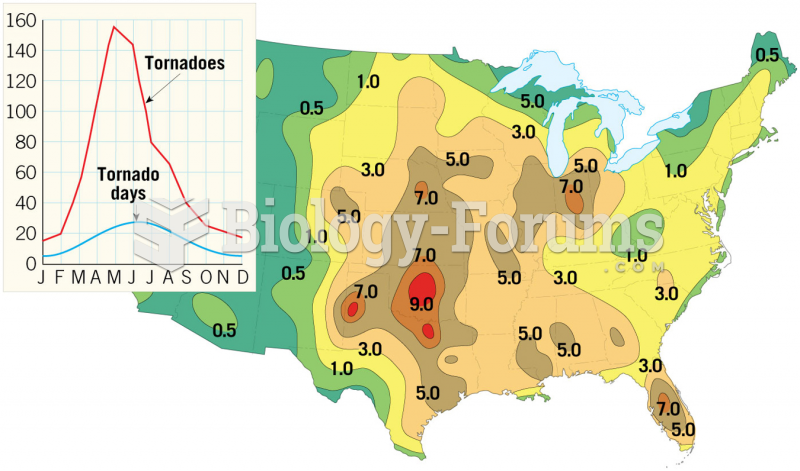 Tornado Occurrence
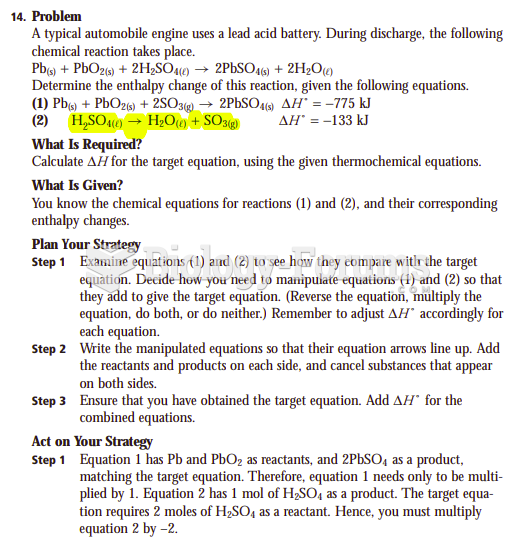 Determine the enthalpy change of this reaction