This topic contains a solution. Click here to go to the answer
|
|
|

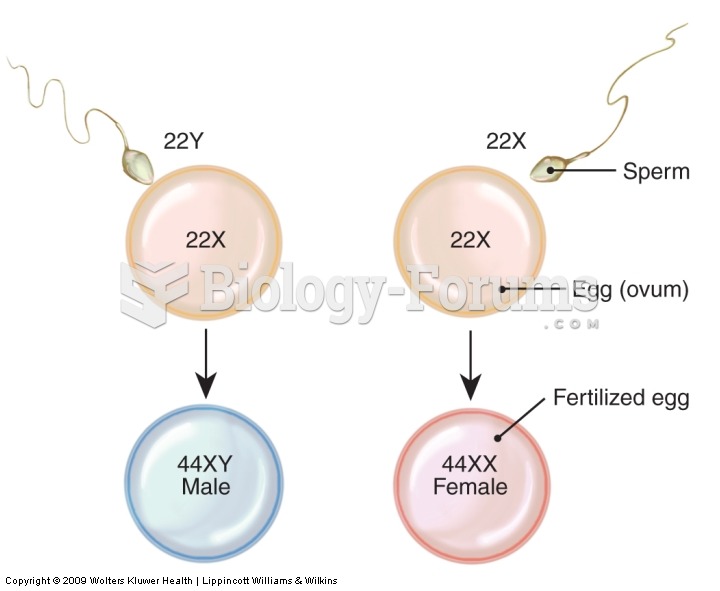 Inheritance of gender.
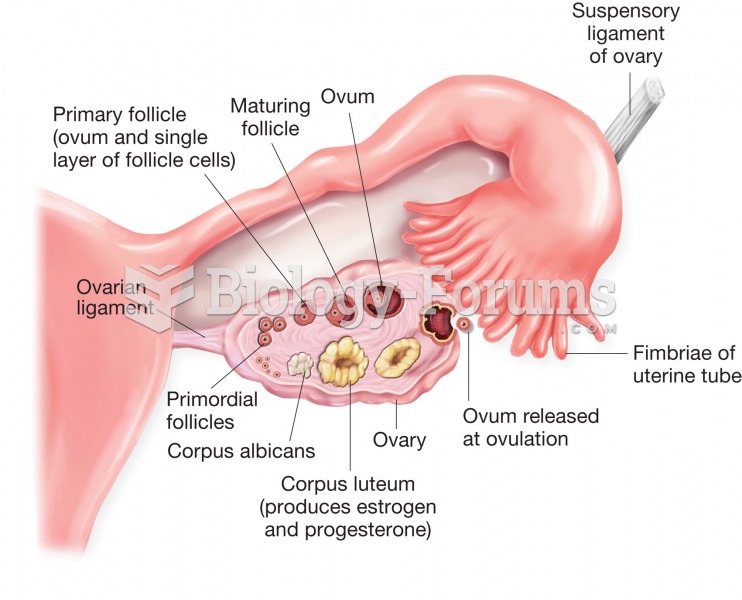 Structure of the ovary and uterine (fallopian) tube. Figure illustrates stages of ovum development a
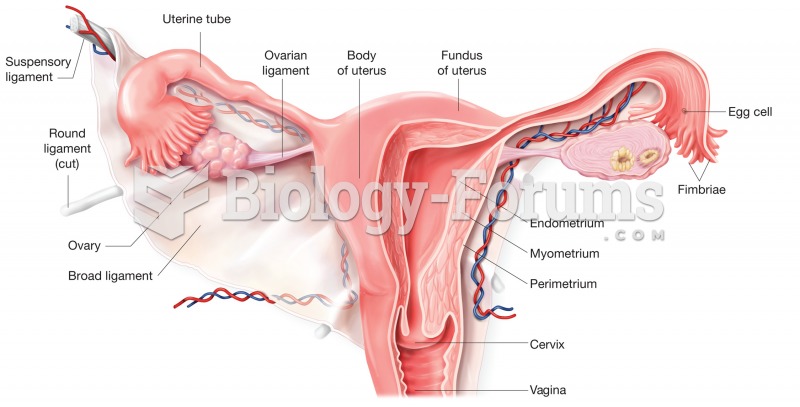 The uterus. Cutaway view shows regions of the uterus and cervix and its relationship to the uterine
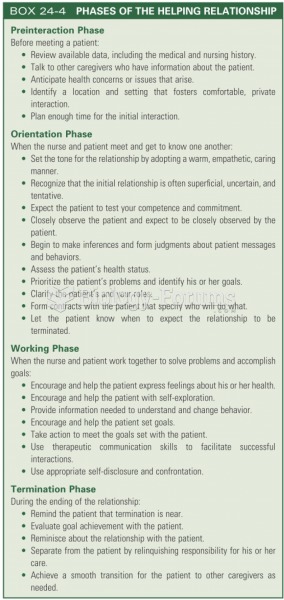 Phases of the working relationship
 Work and Gender: Women at Work in India
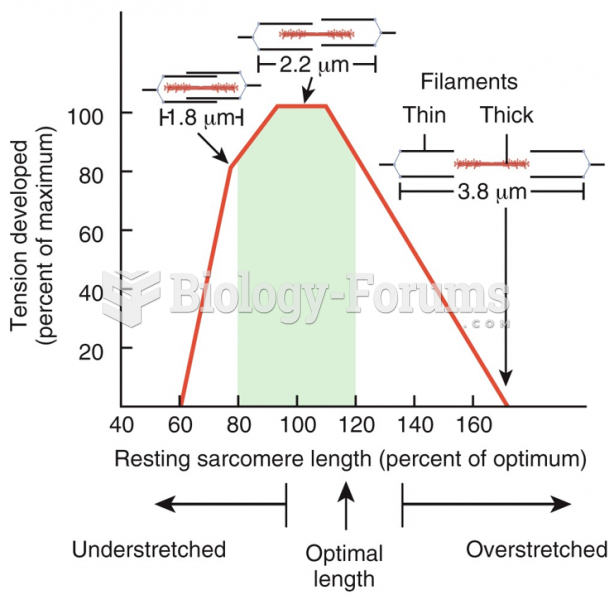 Length-Tension Relationship