Did you know?
The Food and Drug Administration has approved Risperdal, an adult antipsychotic drug, for the symptomatic treatment of irritability in children and adolescents with autism. The approval is the first for the use of a drug to treat behaviors associated with autism in children. These behaviors are included under the general heading of irritability and include aggression, deliberate self-injury, and temper tantrums.
Did you know?
There can actually be a 25-hour time difference between certain locations in the world. The International Date Line passes between the islands of Samoa and American Samoa. It is not a straight line, but "zig-zags" around various island chains. Therefore, Samoa and nearby islands have one date, while American Samoa and nearby islands are one day behind. Daylight saving time is used in some islands, but not in others—further shifting the hours out of sync with natural time.
Did you know?
Tobacco depletes the body of vitamins A, C, and E, which can result in any of the following: dry hair, dry skin, dry eyes, poor growth, night blindness, abscesses, insomnia, fatigue, reproductive system problems, sinusitis, pneumonia, frequent respiratory problems, skin disorders, weight loss, rickets, osteomalacia, nervousness, muscle spasms, leg cramps, extremity numbness, bone malformations, decayed teeth, difficulty in walking, irritability, restlessness, profuse sweating, increased uric acid (gout), joint damage, damaged red blood cells, destruction of nerves, infertility, miscarriage, and many types of cancer.

 Shirin Neshat, Rebellious Silence, from the series Women of Allah.
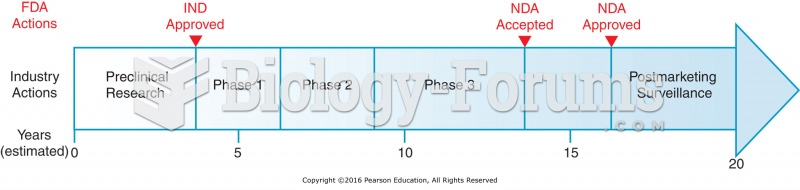 Drug development time line.
 Pattern for percussion: Anterior thorax
 Data management questions
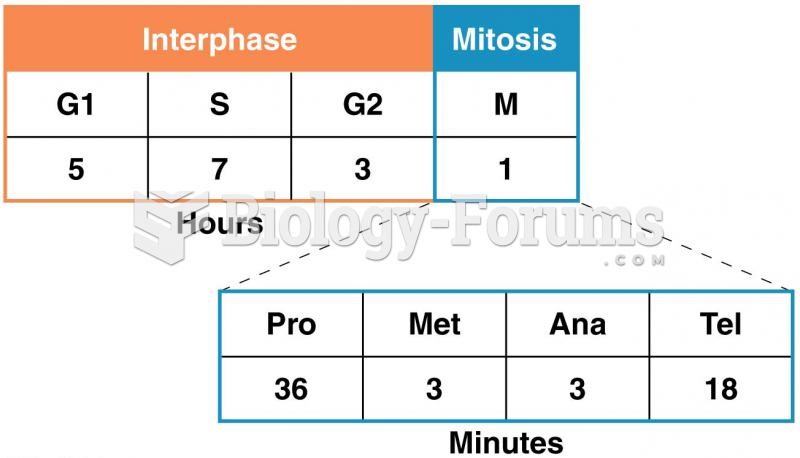 The time spent in each interval of one complete cell cycle of a human cell in culture
 Chi-Square Analysis of Mendel’s Trihybrid-Cross Data