This topic contains a solution. Click here to go to the answer
|
|
|

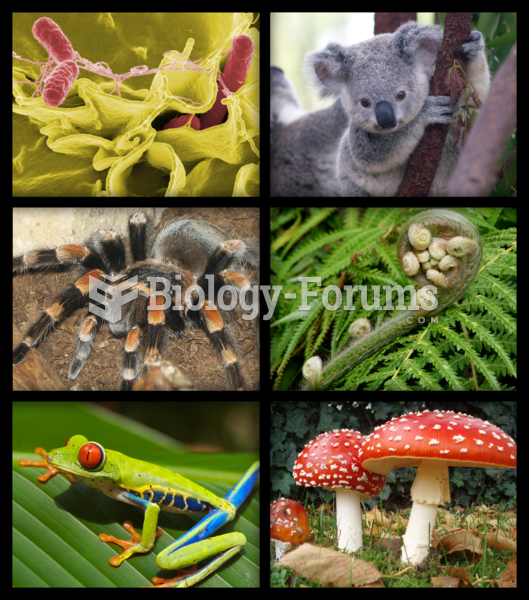 Biology deals with the study of the many varieties of living organisms.
 Use of the tympanic thermometer to measure body temperature.
 Traffic sucks
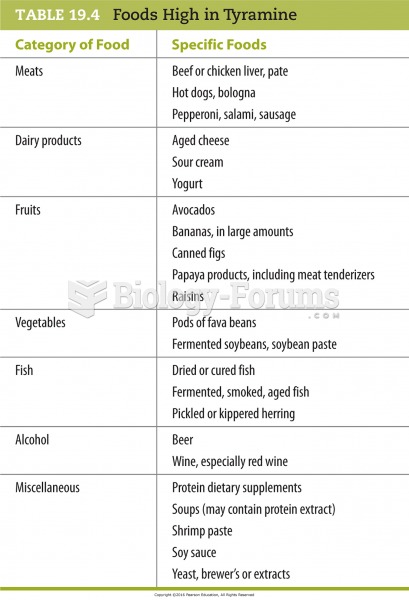 Foods High in Tyramine
 Adiabatic Temperature Changes
 Case Study of a Midlatitude Cyclone