This topic contains a solution. Click here to go to the answer
|
|
|

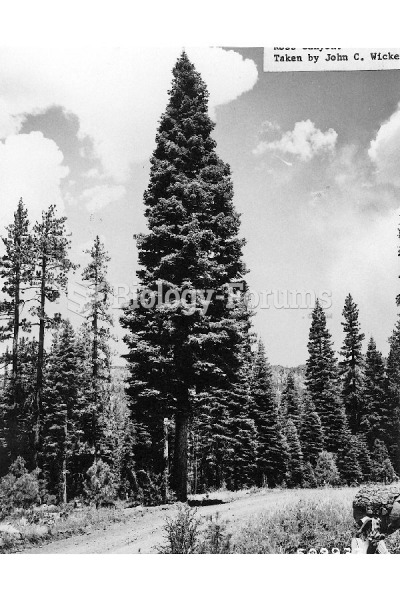 Plant
Plant
 Plant
Plant
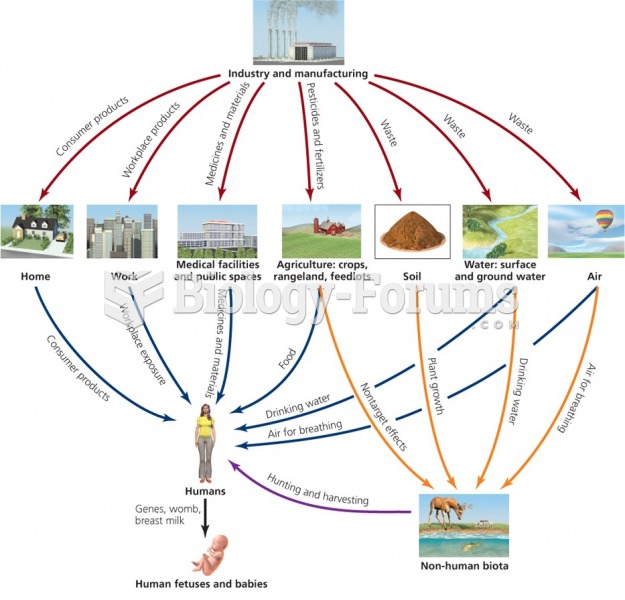 The impact of industry and manufacturing on our life
 Mayan Number
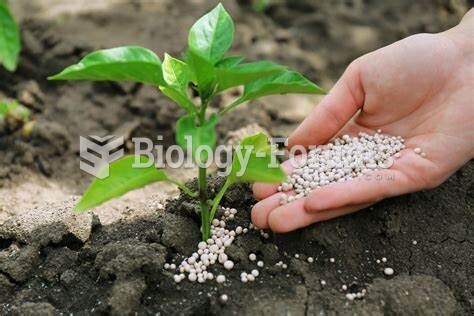 Plant Fertilization
|
|
|
Plant
Plant
The impact of industry and manufacturing on our life
Mayan Number
Plant Fertilization
For a complete list of videos, visit our video library