Answer to Question 1
FALSE
Answer to Question 2
When a process is in statistical control, the points on a control chart should fluctuate at random between the control limits, and no recognizable patterns should exist. The following checklist provides a set of general rules for examining a control chart to see if a process is in control. These rules are based on the assumption that the underlying distribution of process outputand, therefore, the sampling distributionis normal.
a. No points are outside the control limits. Since the control limits are set at 3 standard errors from the mean, the probability of a point falling outside the control limits when the process is in control is only 0.0027, under the normality assumption.
b. The number of points above and below the center line is about the same. If the distribution is symmetric, as a normal distribution is, we would expect this to occur. If the distribution is highly skewed, we might find a disproportionate amount on one side.
c. The points seem to fall randomly above and below the center line. If the distribution is stable, we would expect the same chances of getting a sample above the mean as below. However, if the distribution has shifted during the data collection process, we would expect a nonrandom distribution of sample statistics.
d. There are no steady upward or downward trends of points moving toward either control limit. These would indicate a gradual movement of the distribution mean.
e. Most points, but not all, are near the center line; only a few are close to the control limits. For a normal distribution, about 68 of observations fall within 1 standard deviation of the mean. If, for instance, we see a high proportion of points near the limits, we might suspect that the data came from two distinct distributions (visualize an inverted normal distribution).

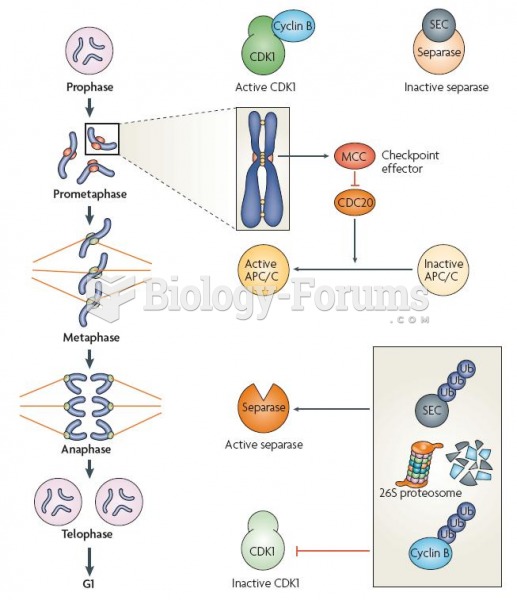 Relationship of the spindle-assembly checkpoint (SAC) with the cell-cycle machinery
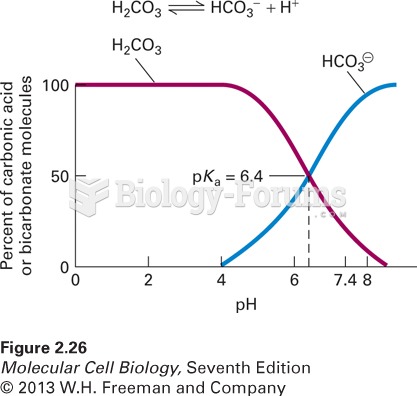 The relationship between pH, pKa, and the dissociation of an acid
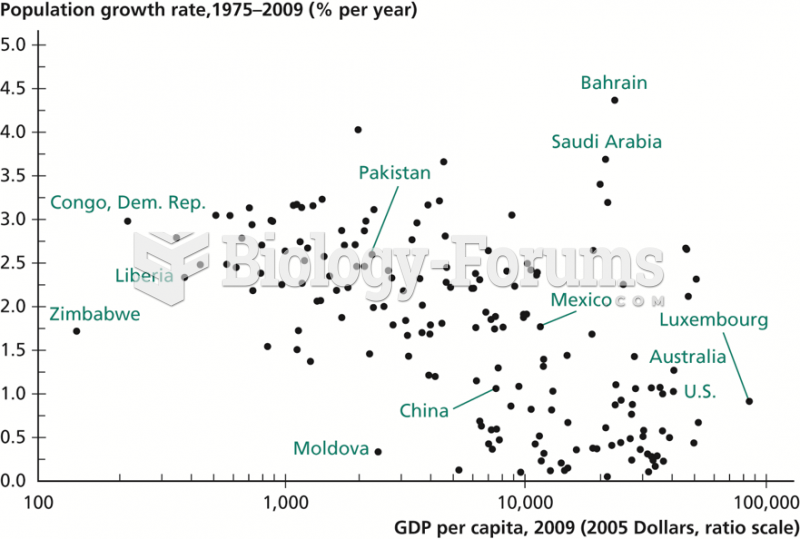 Relationship Between Income per Capita and Population Growth
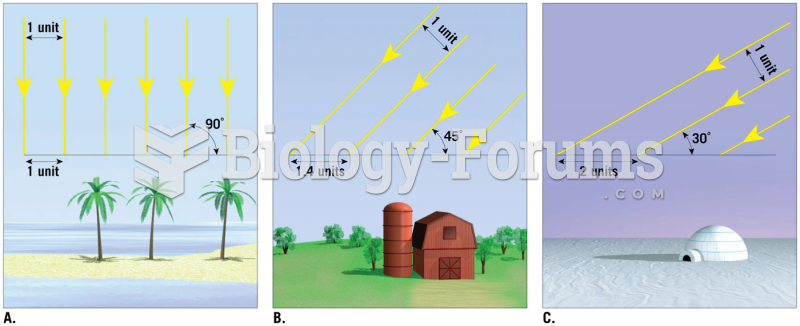 Relationship of Sun Angle and Solar Radiation
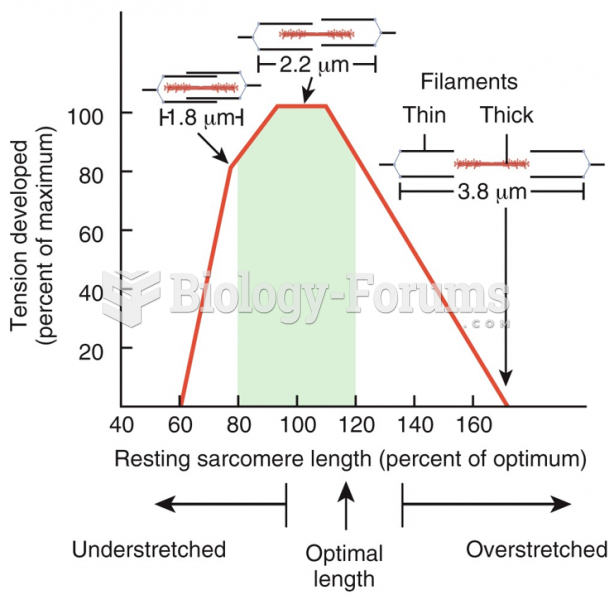 Length-Tension Relationship
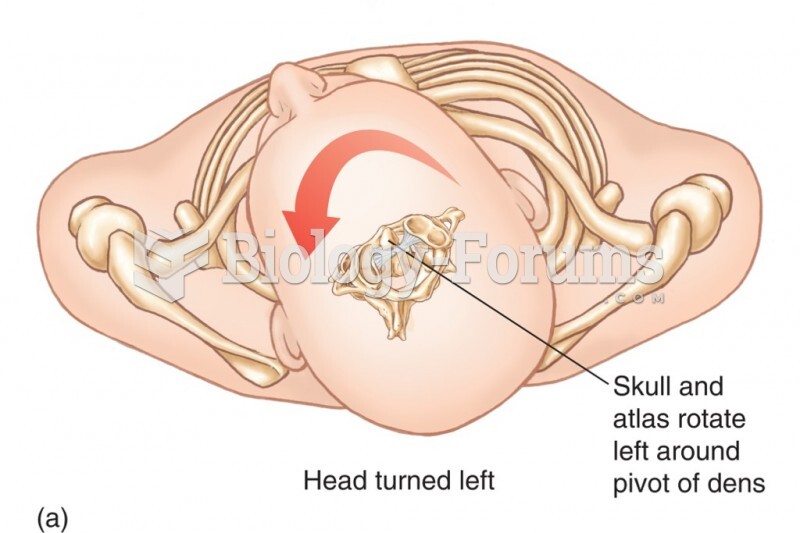 Relationship Between the Atlas and the Axis. The Dens of the Axis Provides a Pivotal Point Around Wh