This topic contains a solution. Click here to go to the answer
|
|
|

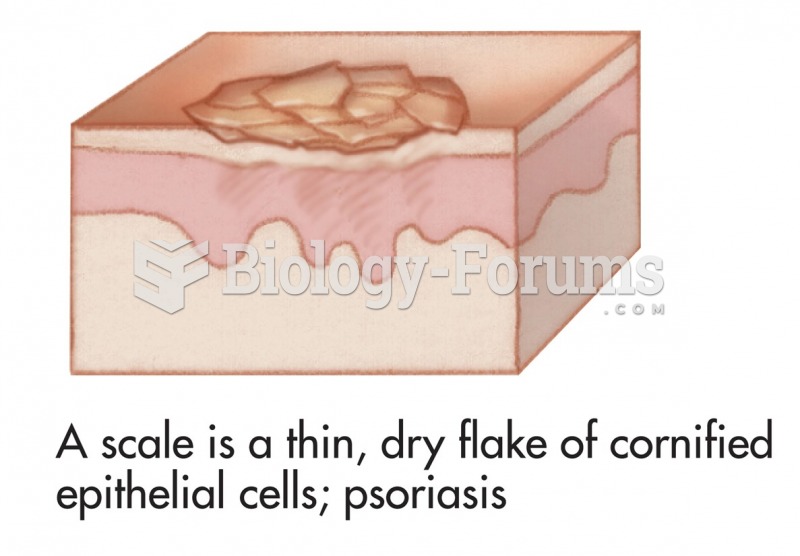 Common skin signs are often evidence of an illness or disorder. A scale is a thin, dry flake of ...
 Thermodynamic Diagrams and Vertical Temperature Profiles
 Production-scale tangential flow filtration system.
 How to create a price index to calculate inflation for a basket of goods
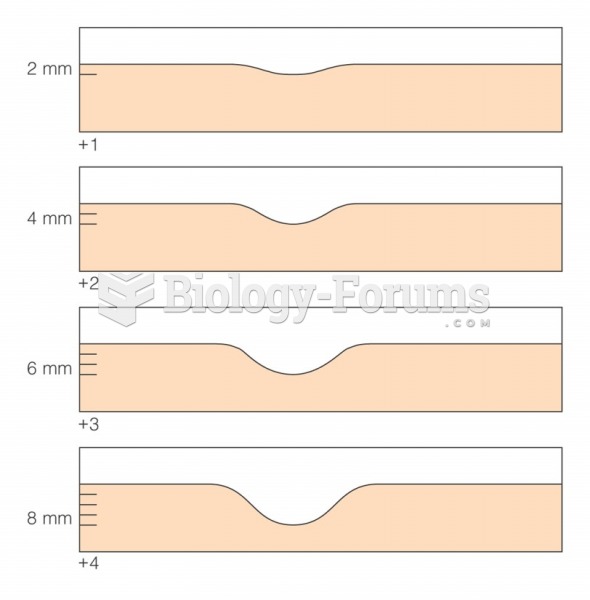 Four-point scale for grading edema
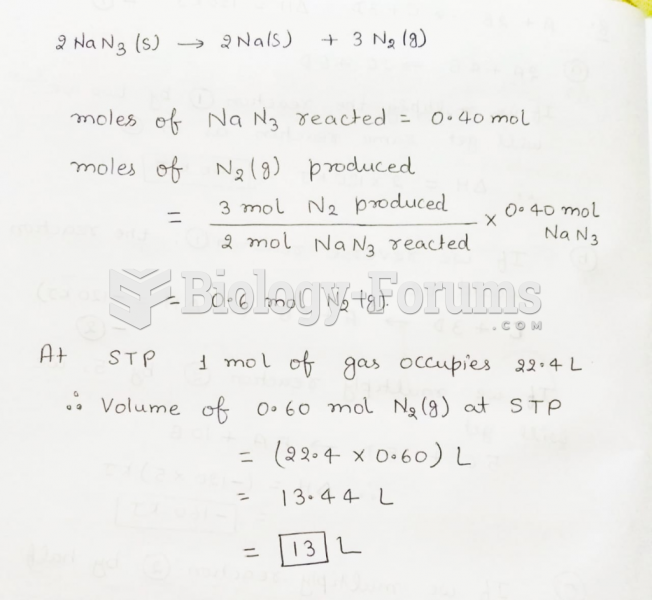 If 0.40 mol of NaN3 reacts completely in the reaction shown below, then ________ L of N2 will ...