This topic contains a solution. Click here to go to the answer
|
|
|

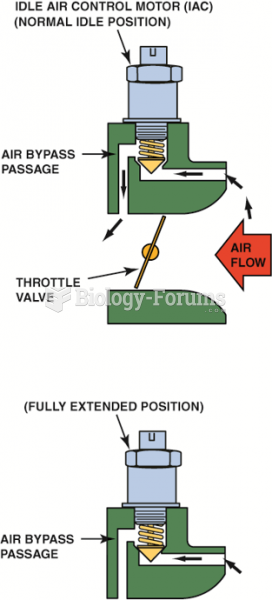 An IAC controls idle speed by controlling the amount of air that passes around the throttle plate. ...
 Find the lateral area, total surface area, and volume of the frustum
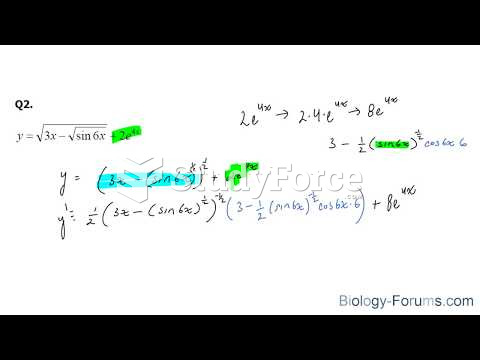 How to find the derivatives of trigonometric functions using the chain rule (Part 2)
 Agricultural Land as a Fraction of Total Wealth in the United Kingdom
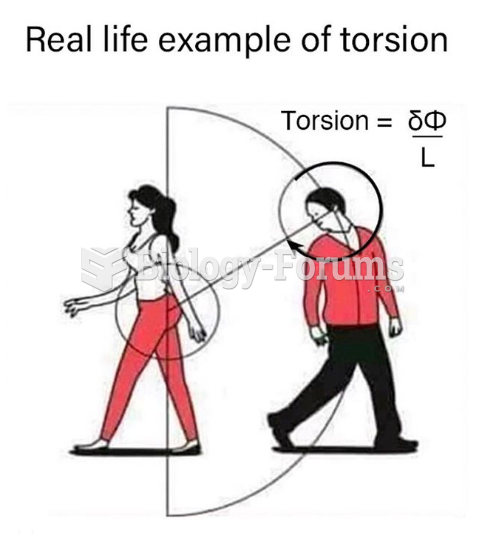 Find the torsion about the male neck?
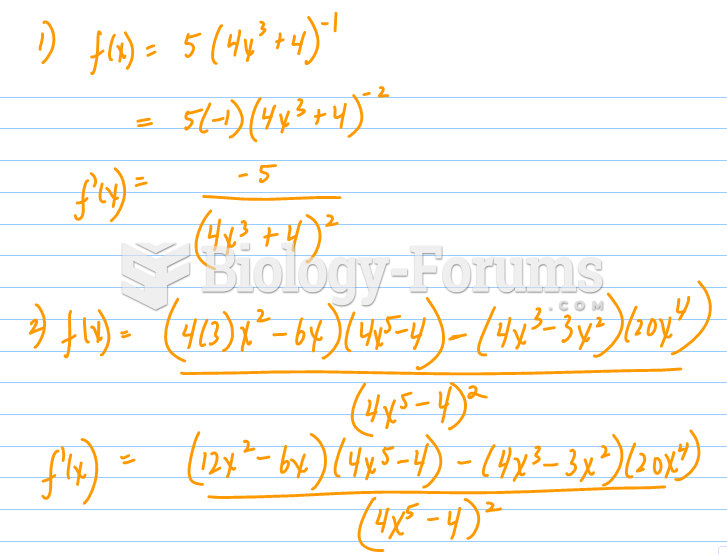 Find derivative using quotient rule