This topic contains a solution. Click here to go to the answer
|
|
|

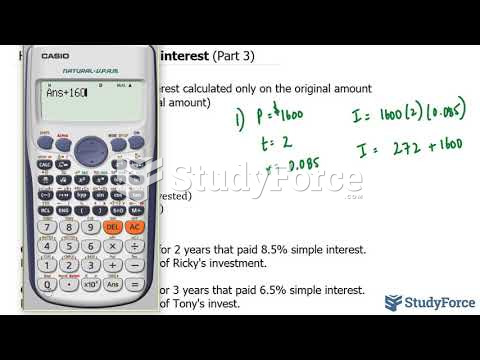 How to calculate simple interest (Part 3)
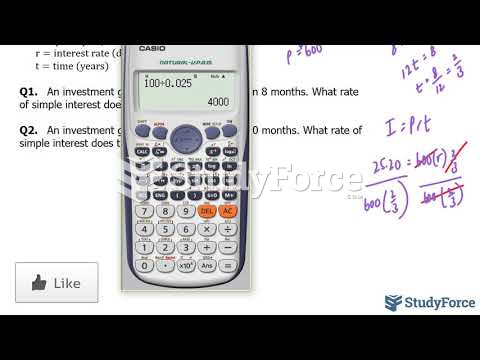 How to calculate simple interest (Part 5; r = I/Pt)
 How to calculate fuel costs
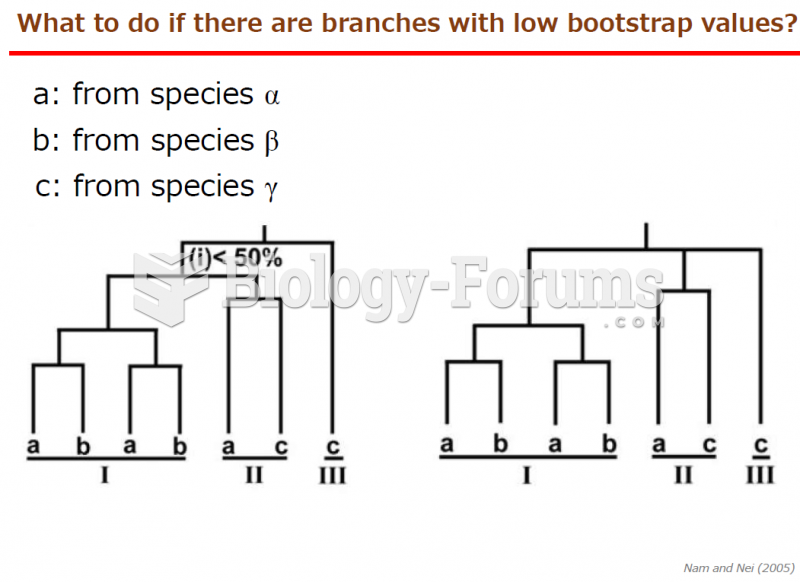 How to calculate the gain and loss gene numbers with low bootstrap of phylogenetic tree?
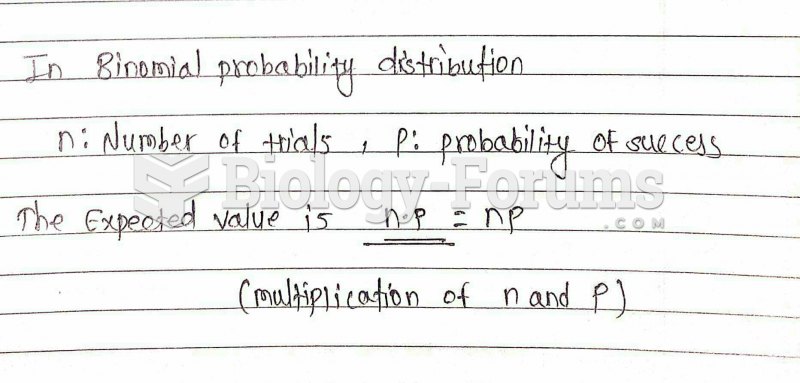 The expected value for a binomial probability distribution is _____.
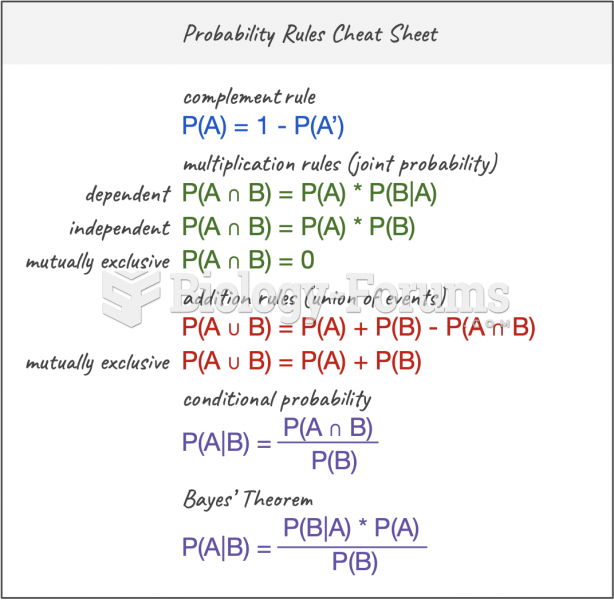 Conditional Probability Formulas