This topic contains a solution. Click here to go to the answer
|
|
|

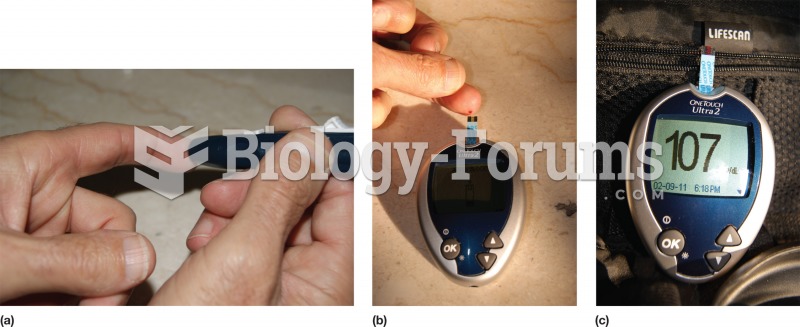 Blood glucose measurement. A postprandial test may be self-administered. (a) A lance pierces the ski
 Sample Exercise Program for Limited Older Adults (cont.)
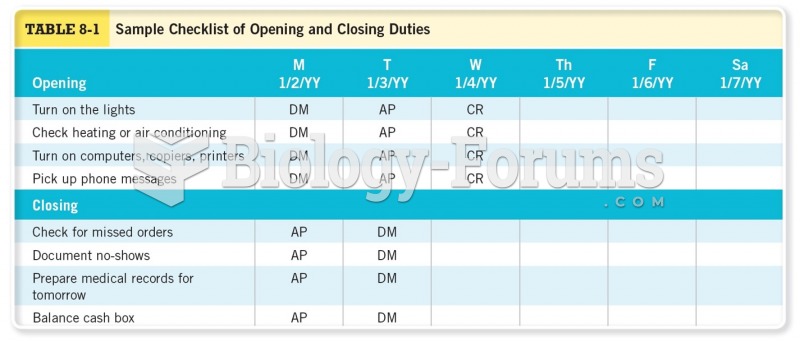 Sample Checklist of Opening and Closing Duties
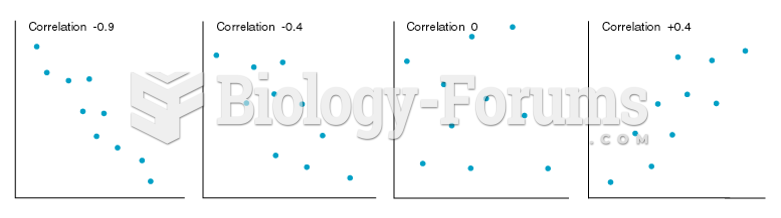 Scatterplots of Variables Having Several Different Levels of Correlation
 A very light ideal spring stretches by when it is used to hang a 135-N object. What is the ...
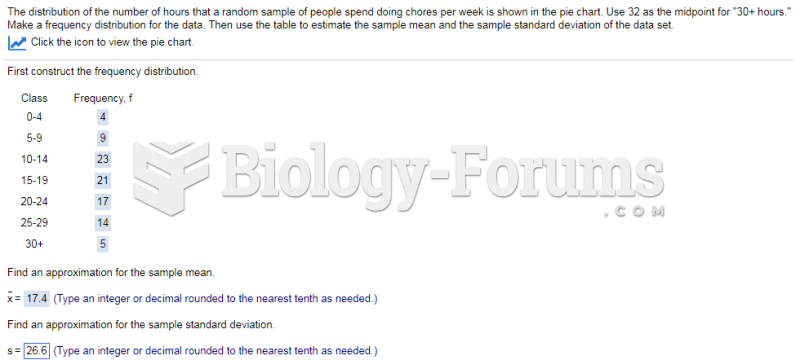 The distribution of the number of hours that a random sample of people spend doing chores per ...