|
|
|

 Comminuted Shatters the affected part into a multitude of bony fragments (x-ray of the femur bone)
 Statistics on how Americans commit suicide
 The path of the conveyor is complex and affected by deep ocean topography
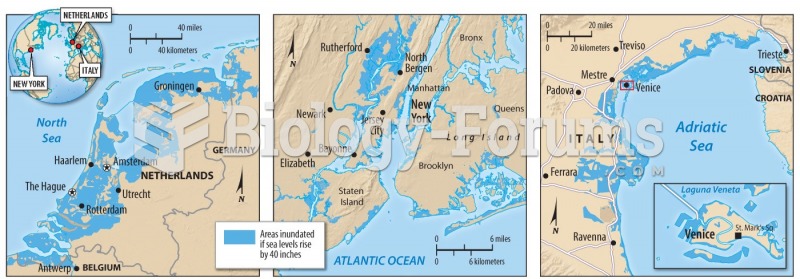 Rising sea level: Some areas will be affected by a rise of just 40 cm
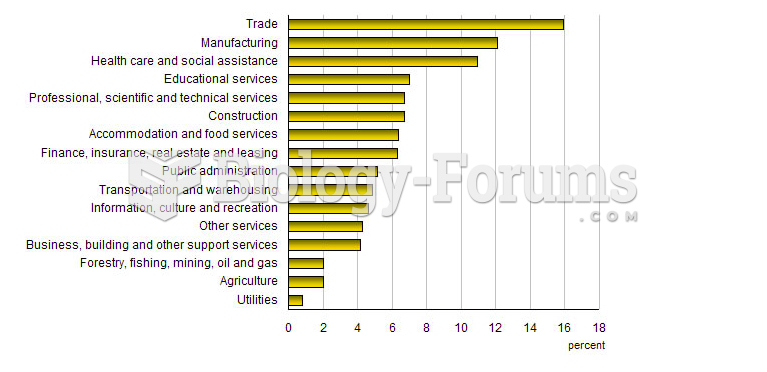 Statistics Canada, Labour Force Survey
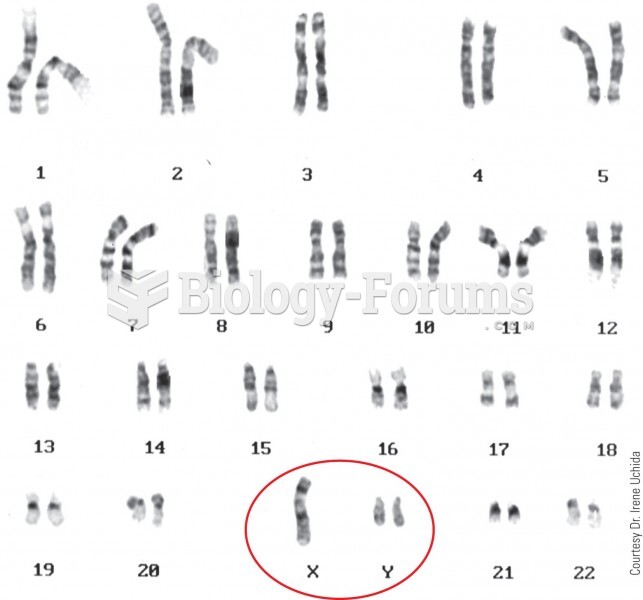 The karyotype of an XYY male. Affected individuals are usually taller than normal, and some, but not