This topic contains a solution. Click here to go to the answer
|
|
|

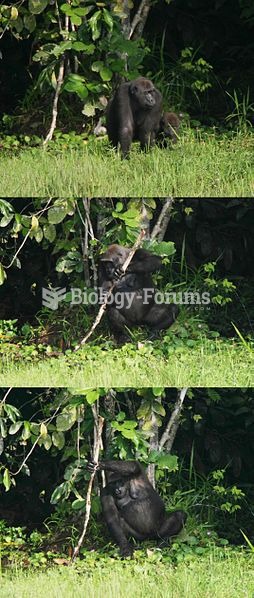 A female gorilla exhibiting tool use by using a tree trunk as a support whilst fishing herbs.
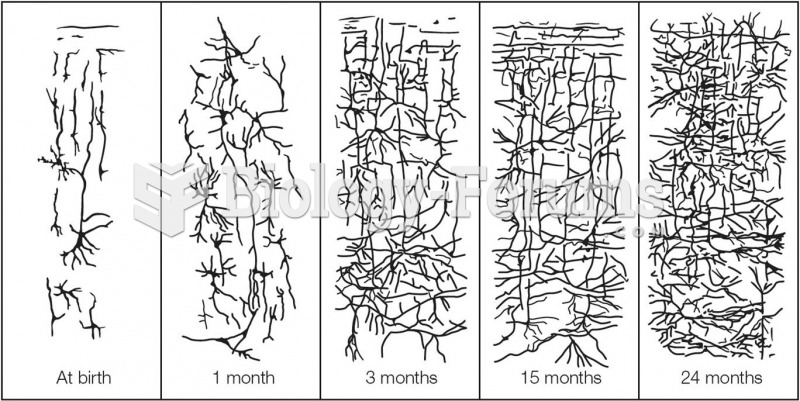 Changes in Synaptic Density From Birth to Age 2 Synaptic connections increase throughout the first
 A fuel composition tester (SPX Kent-Moore J-44175) is the recommended tool, by General Motors, to ...
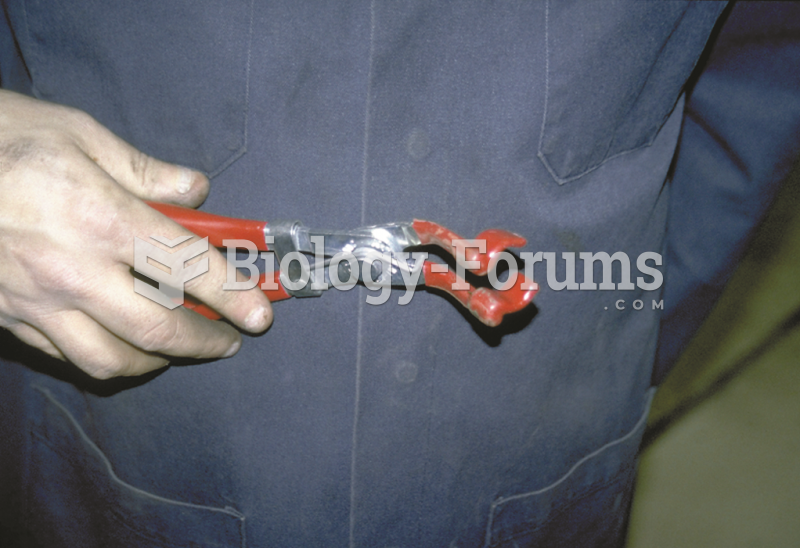 Spark plug wire boot pliers is a handy addition to any tool box.
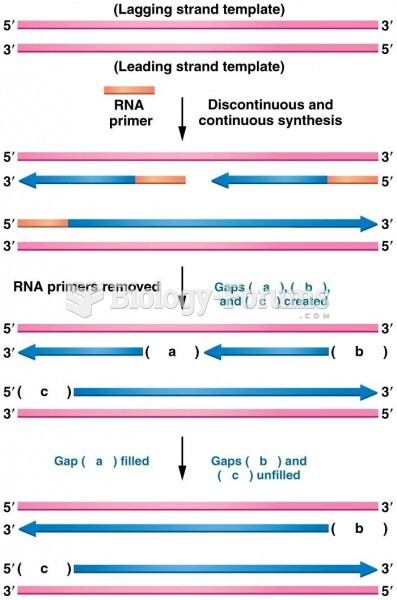 Diagram illustrating the difficulty encountered during the replication of the ends of linear chromos
 Flowchart illustrating how genetic information encoded in DNA produces protein