This topic contains a solution. Click here to go to the answer
|
|
|

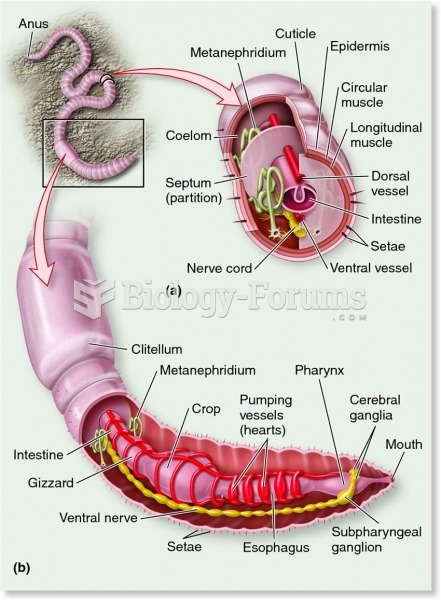 The segmented body plan of an annelid, as illustrated by an earthworm.
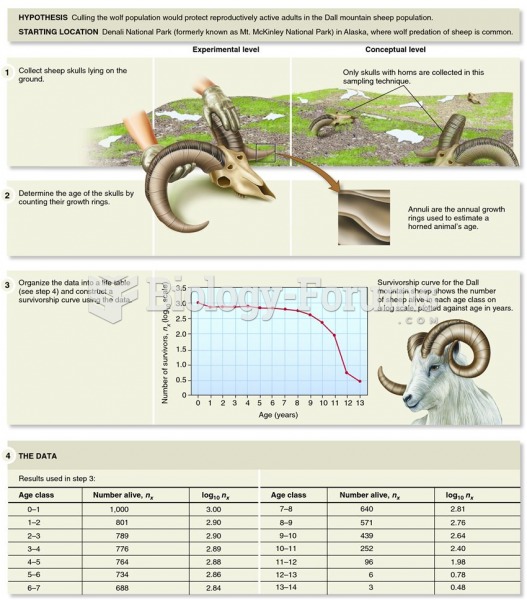 Examining the survivorship curve of a Dall mountain sheep population reveals information on the caus
 Sharing patient information with colleagues is an important nursing role
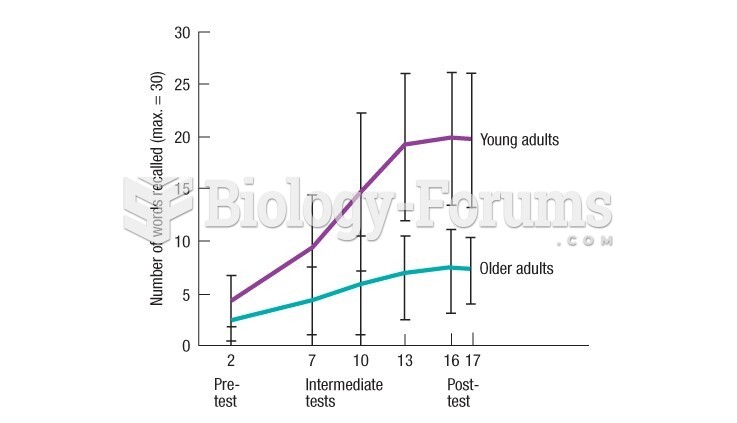 Results from Kliegl's study show that older adults can learn complex information-processing
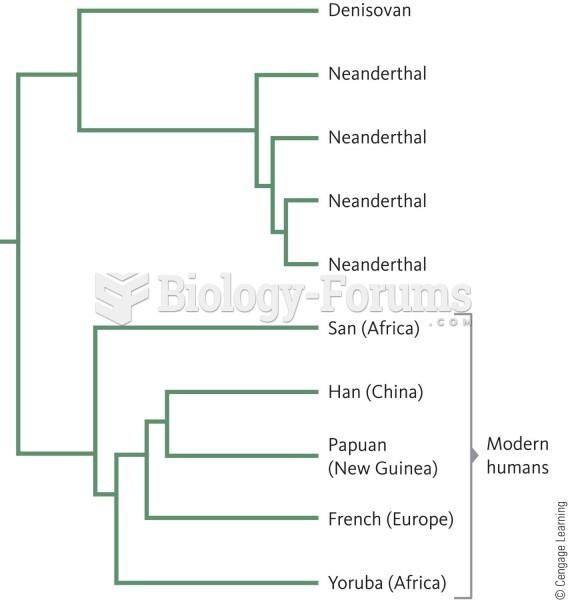 A phylogenetic tree showing that all non-African human populations share a closer genetic relationsh
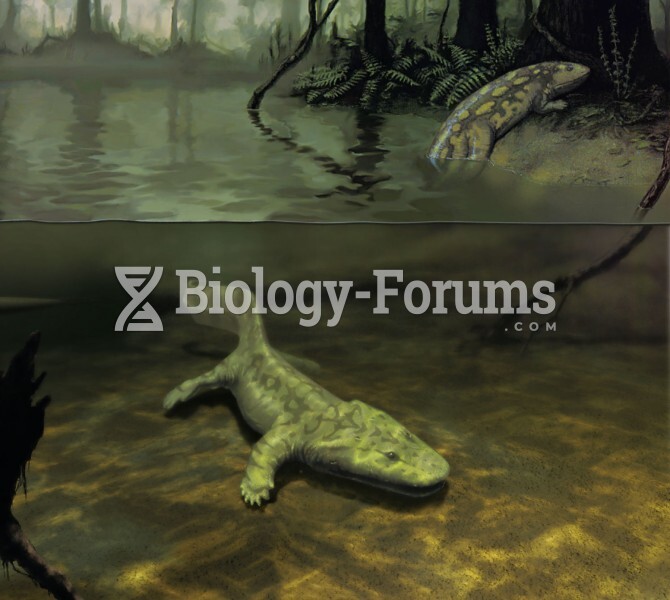 Early Amphibians Illustrated