This topic contains a solution. Click here to go to the answer
|
|
|

 Trignomentry values
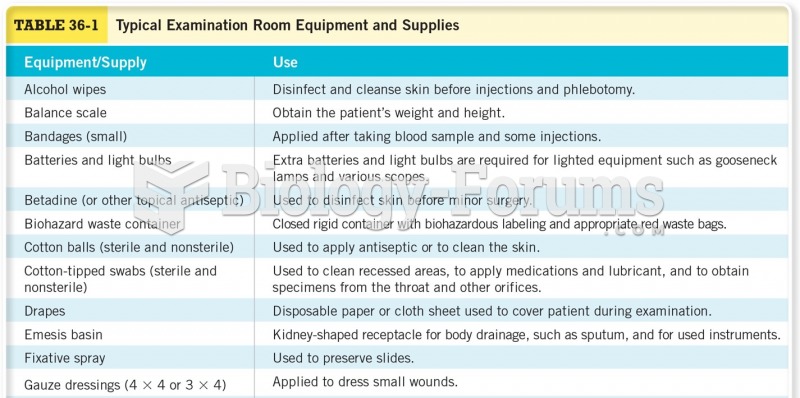 Typical Examination Room Equipment and Supplies
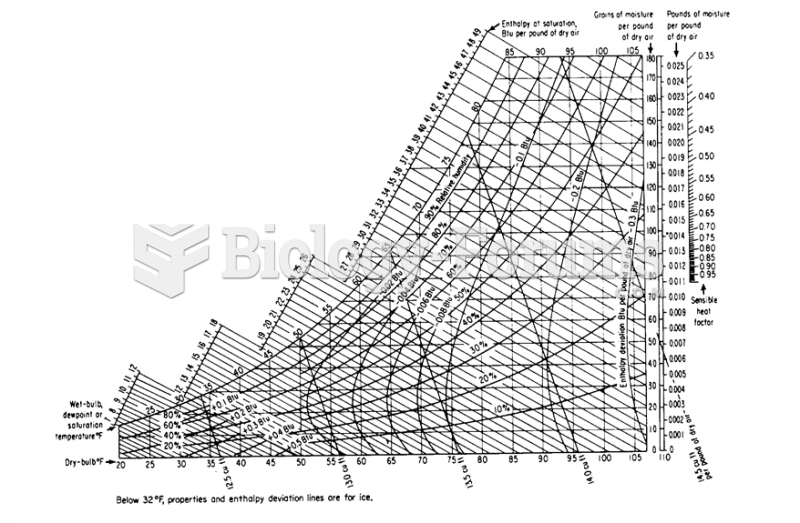 Humidity Chart
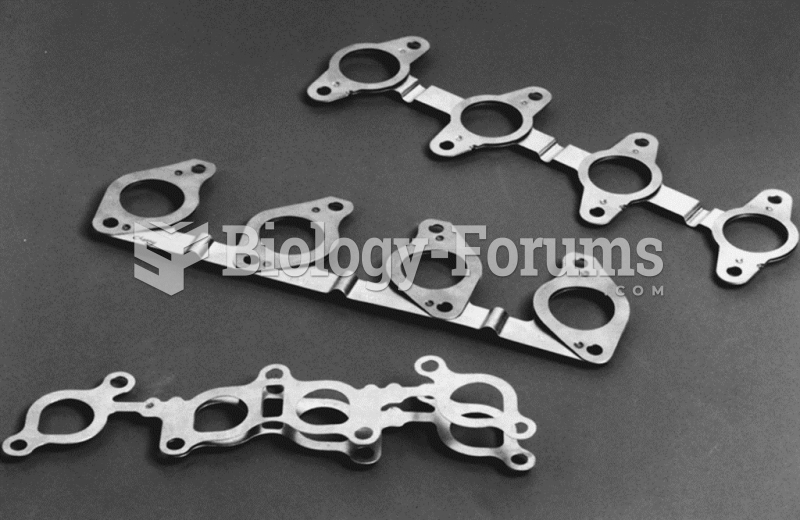 Typical exhaust manifold gaskets. Note how they are laminated to allow the exhaust manifold to ...
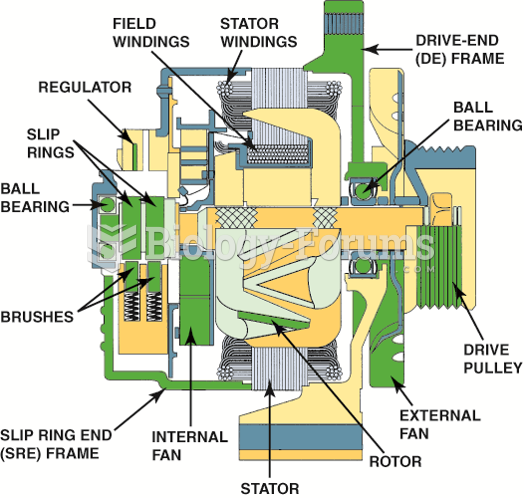 Cutaway view of a typical alternator.
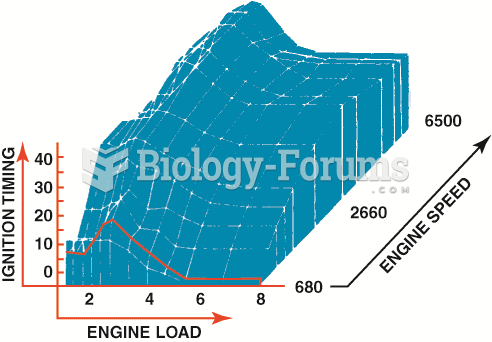 Typical ignition timing map developed from testing and used by the vehicle computer to provide the ...