You have collected time series for various macroeconomic variables to test if there is a single cointegrating relationship among multiple variables. Formulate the null hypothesis and compare the EGADF statistic to its critical value.
(a) Canadian unemployment rate, Canadian Inflation Rate, United States unemployment rate, United States inflation rate; t = (-3.374).
(b) Approval of United States presidents (Gallup poll), cyclical unemployment rate, inflation rate, Michigan Index of Consumer Sentiment; t = (-3.837).
(c) The log of real GDP, log of real government expenditures, log of real money supply (M2); t = (-2.23).
(d) Briefly explain how you could potentially improve on VAR(p) forecasts by using a cointegrating vector.
What will be an ideal response?
Question 2
Consider estimating a consumption function from a large cross-section sample of households. Assume that households at lower income levels do not have as much discretion for consumption variation as households with high income levels.
After all, if you live below the poverty line, then almost all of your income is spent on necessities, and there is little room to save. On the other hand, if your annual income was 1 million, you could save quite a bit if you were a frugal person, or spend it all, if you prefer. Sketch what the scatterplot between consumption and income would look like in such a situation. What functional form do you think could approximate the conditional variance var(ui Inome)?
What will be an ideal response?

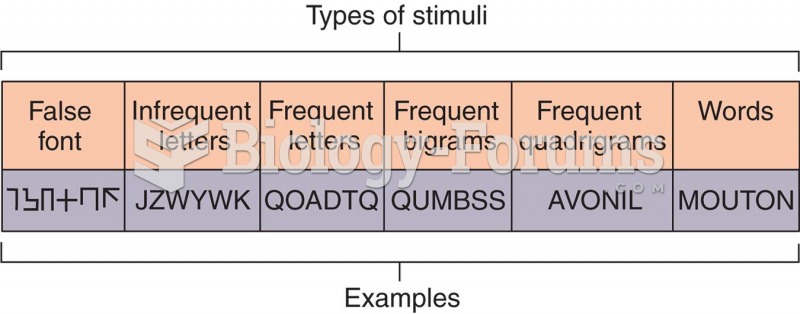 Stimuli Used in a Test of Word Recognition
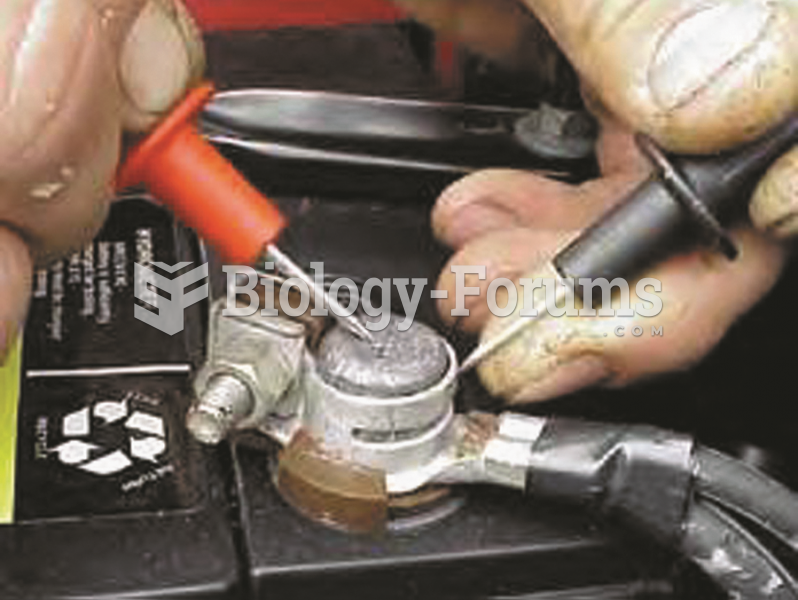 Using the voltmeter leads from a starting and charging test unit to measure the voltage drop ...
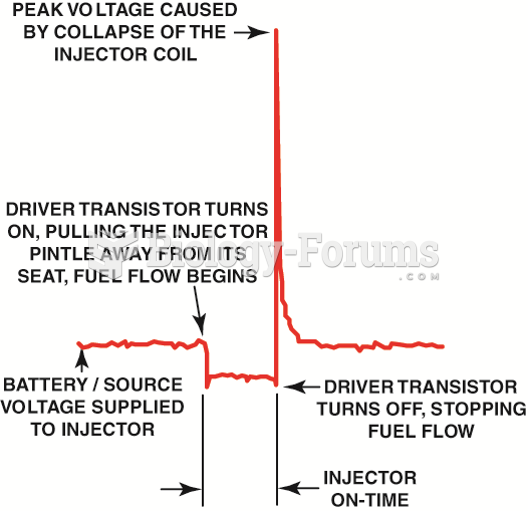 The injector on-time is called the pulse width.
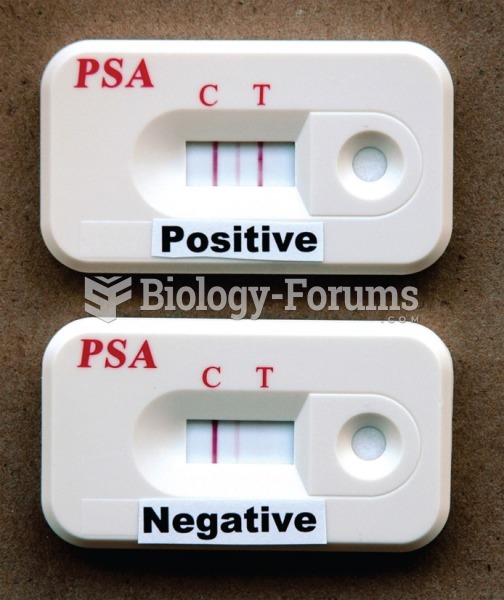 Prostate-specific antigen test.
 Press into points along the neck with your thumb, one side at a time. Apply circular friction to ...
 Performing the whisper test