The table accompanying lists the joint distribution of unemployment in the United States in 2001 by demographic characteristics (race and gender).
Joint Distribution of Unemployment by Demographic Characteristics,
United States, 2001
White
(Y = 0) Black and Other
(Y = 1) Total
Age 16-19
(X = 0) 0.13 0.05 0.18
Age 20 and above (X = 1) 0.60 0.22 0.82
Total 0.73 0.27 1.00
(a) What is the percentage of unemployed white teenagers?
(b) Calculate the conditional distribution for the categories white and black and other.
(c) Given your answer in the previous question, how do you reconcile this fact with the probability to be 60 of finding an unemployed adult white person, and only 22 for the category black and other.
What will be an ideal response?
Question 2
In the panel regression analysis of beer taxes on traffic deaths, the estimation period is 1982-1988 for the 48 contiguous U.S. states.
To test for the significance of entity fixed effects, you should calculate the F-statistic and compare it to the critical value from your Fq, distribution, where q equals
A) 48.
B) 54.
C) 7.
D) 47.

 Prosthetic hip joint.
 The cultural script in the United States is for males to be the initiators and females the ...
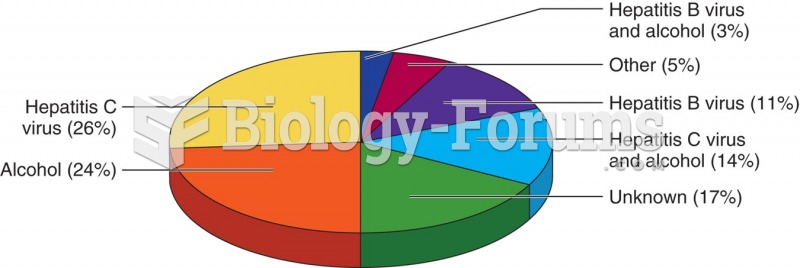 Primary causes of chronic liver disease in the United States.
 Apply draining stroke to forearm. Hold forearm off of the table with one hand. With the other hand, ...
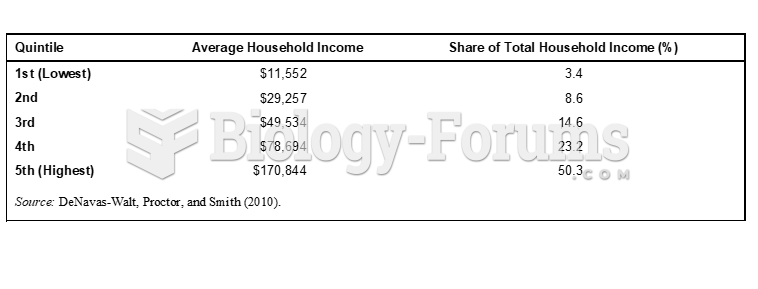 Household Income in the United States by Quintiles, 2009
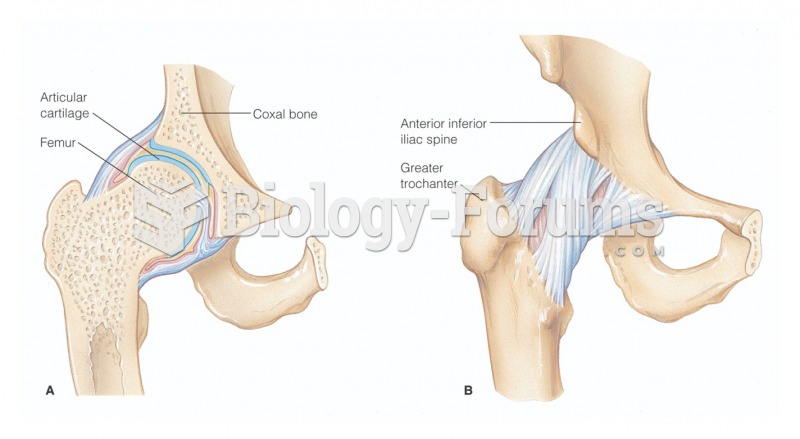 Hip joint